


The following is an excerpt from Richard Russell's Dow Theory Letters
"Some problems are so complex that you have to be highly intelligent and well-informed just to be undecided about them." Dr. Lawrence Peter through courtesy of Marc Faber.
Little did I know back in 1958 when I first started writing about the stock market and Dow Theory that I'd still be writing about the stock market at the tender age of 88. This Sunday we're having a party with, from what I gather, all my kids -- along with two of my lovely ex-wives.
O.K. I want to start with some good news. Robert Campbell of the Campbell Real Estate Timing Letter, (he was one of the first to warn of the housing bust) has mailed out his latest report, and in it he states that he has just received "more signs of a housing recovery." His "Real Estate Crash Index" has just signaled a buy for San Diego and Southern California housing. Robert uses a collection of technical indicators that he puts together to construct a real estate barometer. And I call his latest bulletin really good news.
Of course, I wanted to check Campbell's glad tidings with a few charts. The first chart is Realty Major Shares, and this chart is clearly bullish. A bullish "cup and handle" formation.

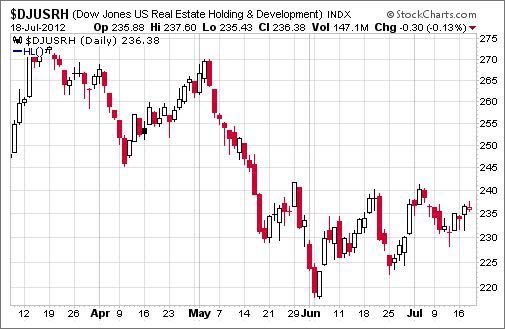
The chart below is the D-J US Real Estate Holdings chart, and it appears to be forming a good base.
Confirming the above two charts is this NYSE Real Estate Shares chart. The chart shows a clear upside breakout. Another bullish "cup and handle" formation.

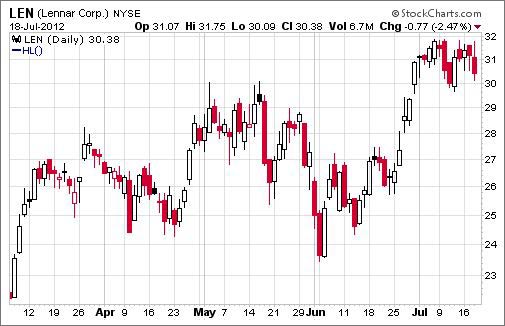
Now let's look at a few major homebuilders. We'll start with Lennar -- which is clearly bullish.
Below is KB Homes -- bullish.

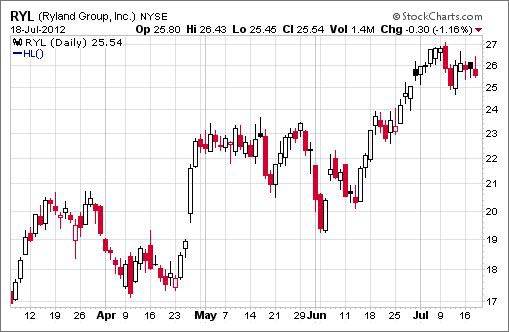
My final chart in this group is Ryland, and the chart is also bullish. So my conclusion is that yes, Robert Campbell could be right. Housing may have hit bottom and turned up -- and the charts confirm this bullish view.
Housing has been one of the bearish sectors of the economy and the stock market. If housing has really turned bullish, it should be confirmed by the Dow Theory and the Averages. So let's see if the Industrials and Transports can both close above those May peaks, which to refresh your memories were 13,279.32 and 5285.97.
See, I told you that I wanted to be bullish. But this is a very strange bear market. The economy acts more like a bear market than do the Averages. Business activity is slowing down, and the latest NY Times poll now shows Obama and Romney in a statistical tie. Evidently, voters are less and less satisfied with the way Obama is dealing with the economy.
But is it all Obama's fault? The fact is that as far as Dow Theory is concerned, we're still in a bear market, and that is probably more than Obama can overcome.
As I write, the Transports are at 5204 -- only 81 points below their May peak. Industrials are at 12,948, only 331 points below their May breakout point.
So the question remains, will one or both Averages remain below their May peaks, or will both Averages better their May peaks, and in so doing, tell us that the bull market is still in force?
To read the rest of Richard Russell’s Dow Theory Letters, click here to subscribe.


