


Over the last three or four years the supply of natural gas available to the U.S. market has jumped sharply higher with the advent of advanced drilling technology and multi-stage hydraulic fracturing. It was only a decade ago that experts were debating how the U.S. would meet their natural gas needs and exploring the need for imports, a problem that was solved by technological advances.
Nature of Gas Markets
Natural gas markets are somewhat unique in that they are highly cyclical. Winter demand for space heating in the residential and commercial sectors is highly dependent on ambient temperatures. To address the logistics of getting the natural gas from a well in Texas to Chicago engineers for the pipelines and local distribution companies and end users have built a series of underground storage reservoirs so they could move the gas closer to market to service peak periods of demand. Natural gas is transported and injected into these facilities during months when end user demand slows, generally from April to November.
[Must Listen: Joseph Dancy: Strong Economics for Natural Gas]
These underground storage facilities are customarily located in depleted oil or natural gas fields, salt caverns, aquifers, or similar types of underground structures that have the physical integrity to store the natural gas for later use. The U.S. Energy Information Administration (EIA) tracks weekly storage levels of these facilities and issues a report each week with estimates of the amount of natural gas that was injected or withdrawn from the storage system.
Brutal Cold Lifts Demand
The brutally cold weather in the Northern Plains, Midwest, and Northeast has resulted in some of the largest weekly draws seen in the last decade. Many storage facilities in these areas have inventory levels that are nearing depletion.
Source: U.S. Energy Information Administration
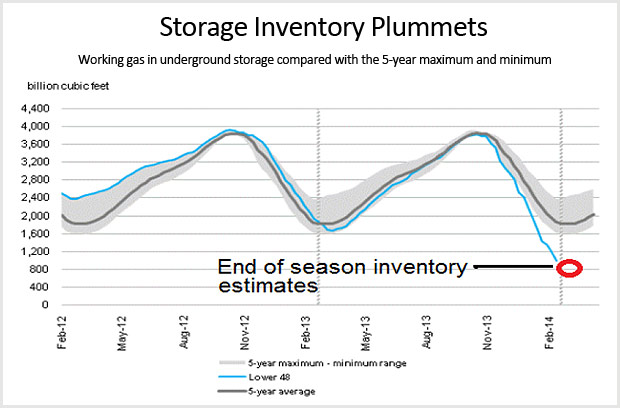
With the cold weather remaining in place the ability of pipeline systems to supply natural gas to high volume industrial and utility users has been stretched to the limit. A chart of storage levels from the EIA is set out at right, with end of withdrawal season estimates.
Data indicates 953 billion cubic feet (bcf) of gas is in storage as of March 14th, the lowest for this week in a decade or more, with more gas expected to be withdrawn over the next few weeks as the winter and heating season comes to an end.
Record Gas Draws
The prolonged, widespread, and bitter cold weather throughout much of the northern plains, Midwest, and northeast has led to record-breaking natural gas withdrawals. The EIA’s data indicate that four of the top ten weekly draws occurred this year.

Source: U.S. Energy Information Administration

Source: U.S. Energy Information Administration
“Robust” Injection Season
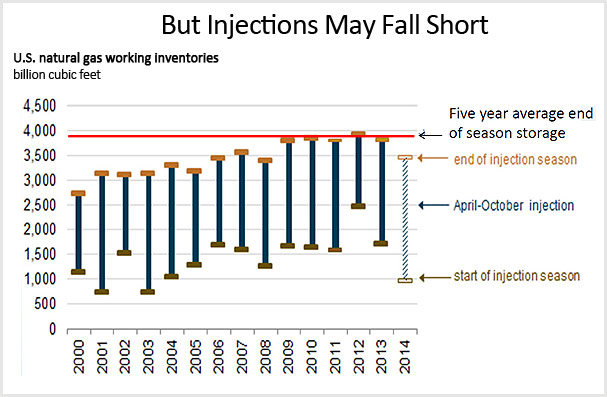
Based on the severely depleted level of storage the EIA is projecting a “robust injection season” (April-October) with a record 2,500 billion cubic feet (Bcf) added to storage as operators seek to rebuild inventory levels. Even with the record injections projected storage will not reach the 3,800 billion cubic feet level we have seen the last five years.

Source: U.S. Energy Information Administration
Source: U.S. Energy Information Administration
Normally filling storage to 3,500 bcf instead of 3,800 bcf would not generate much attention in the marketplace, but keep in mind that demand for natural gas has increased substantially in the last few years and should continue to expand.

Source: U.S. Energy Information Administration
Several additional factors will add additional stress to the natural gas markets this summer:
- The amount of natural gas needed to reach ‘normal’ injection season storage levels will set injection records; Daily injection volumes will need to average 40-50% higher than last year’s levels to fill storage.
- The market for natural gas is expanding for both petrochemicals and utility use for both economic and environmental reasons, and new emission control requirements on coal fired utility plants is reducing the availability of these units to backup natural gas fired facilities
- The drought in California, and offline nuclear generating facilities, mean the State will use more natural gas for electrical generation than has been the case historically.
 Natural gas exports to Mexico continue to ramp up, with more of their demand met by imports from the U.S. (EIA chart at right).
- An active hurricane season could disrupt natural gas production in the Gulf of Mexico and in coastal areas.
- A hot summer could add pressure on the natural gas markets as the fuel is burnt in electrical peaking plants to meet air conditioning demands.
- Natural gas storage in Eastern Canada is at very low levels, so exports from Canada this summer will likely be substantially smaller than historical levels
- The longer term ensemble weather forecasts continue to indicate a cooler than normal end of March and early April for the Northern Plains, Midwest, and Northeast. Natural gas has historically been withdrawn from storage until the first week of April, after which injections begin the refill process until the first week of November. A weather induced delay in injections would make the refill process even more challenging.
- The number of drilling rigs operating for natural gas remain depressed, although ‘associated gas’ is being produced in large quantities from oil and liquids-based prospects that adds substantially to natural gas supplies. It will be difficult for newly drilled associated gas by itself to meet the increased volumes need to fill storage.
- Spot prices at the various delivery hubs have recently spiked with demand, and natural gas liquids are also in demand as propane and heating oil use reflected the severely cold weather. ‘Wet gas’ from natural gas wells has become more valuable as the price for the liquids moves upward.
- Recent spikes in natural gas prices in New York and elsewhere reported by Bloomberg illustrates the distribution system bottlenecks that have arisen as gas consumption increases. While the Northeast traditionally relied on heating oil, for economic reasons natural gas has made large inroads in the heating market in the last decade.
- While total supplies of natural gas available to meet market demands should be adequate, the infrastructure to store and delver such gas at times of peak demand will need to be substantially upgraded and expanded over time as demand increases.
- The EPA’s Mercury and Air Toxics Standards (MATS) are forecast to cause roughly 15% of the U.S. coal fired generation plants to close in the next year. While many of these plants are older and have reached their economic limits, they may not be available if needed to supplement electricity supplies this summer.
- Decline curves for natural gas unconventional shale wells continue to be much steeper than conventional wells, which means that drilling needs to continue at a robust pace to maintain production and deliverability levels.


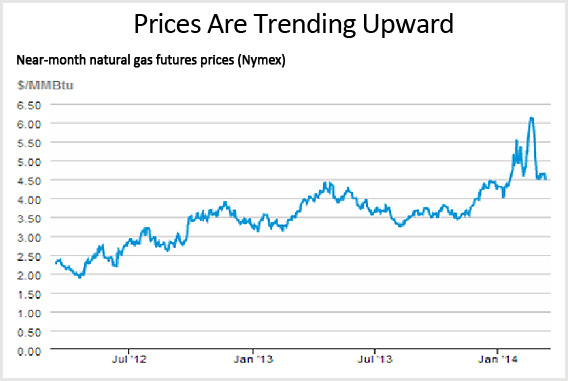
Prices Trending Upward
The record natural gas demand, coupled with the extreme cold, have driven natural gas prices upward over the last few months.

Source: U.S. Energy Information Administration
Source: U.S. Energy Information Administration
Refill Issues
While the markets expect a record volume of gas to be injected into storage gas prices have not spiked as they occasionally done in the past. Analysts are projecting ending natural gas storage between 800 and 900 Bcf. Storage levels have not been that low since April, 2003, when they dipped to 642 Bcf — and the following summer of 2003 saw natural gas prices spike to over per thousand cubic feet.
Storage Refill Issues:
- Infrastructure to transport
- Infrastructure to process
- Well & field deliverability
- Tech & efficiency improvements
- Weaker plant demand
- Gas to coal switching
- Gas price needed to fill storage
It is clear that we have a vast amount of unconventional natural gas reserves in the ground. Wellhead deliverability continues to rise even with the relatively low number of natural gas focused rigs, but the ability to physically produce and transport this gas to the needed markets is a concern. The volumetric capacity to process wellhead gas to insure it is pipeline quality is also a concern.
Gas Markets
Moving forward into the summer of 2014 it is unlikely we will see a major spike in natural gas prices, but the fact is an additional four to five billion cubic feet per day will need to be injected into facilities to attain the ‘normal’ 3,800 Bcf level by the start of heating season. As noted above the EIA projects a ‘fill’ of 3,500 Bcf, which is still a record amount of injected gas, but we think a higher end point will be desirable by industry players in case next winter is equally cold.
[Hear Also: Kurt Wulff: There Is Value in Energy - Mid Cap Independent Producers Are in the Sweet Spot]
The ability to process, transport, and inject the projected volumes is dependent on a number of factors including the weather, gas to coal switching, pipeline and gathering systems capacity, among others. Coupled with record volumes required, we think the odds are such that price incentives will be needed to enhance gas supplies into storage. As such we expect higher domestic natural gas prices, possibly surprisingly so, this summer and fall.
Investment Implications
Even as the volume of crude oil and natural gas produced from unconventional domestic wells continues to increase substantially, the stock market has not treated exploration and production companies well compared to the S&P 500 Index.

Source: U.S. Energy Information Administration
Looking at historical data, the main driver of shareholder value for an exploration and production firm has been strongly growing production and reserves. For service companies the major driver has been revenue growth. Major producers have had difficulty in growing either lately, and costs of discovery have substantially increased over the last decade according to a recent study released by the International Energy Agency. For these reasons we expect stock selection to be the key to excess returns in the sector.
Attractive Energy Sector Firms
The S&P 500 Index, used as a benchmark by many active portfolio managers, has increased by roughly 20% over the last 12 months. The average firm in that Index has increased revenues less than 5%.
If we run a simple screen looking for Texas energy companies that are performing twice as well or better than the S&P 500 Index, while at the same time increasing revenues at an incredible rate of 25% per year or more, we find the following “All Star” list of companies:

Note the median firm on this list outperformed the S&P 500 index by a factor of five — and had a torrid median trailing twelve month revenue growth of 69%. Due to the lack of respect the market has had for most of the companies in the energy sector, as we search for excess returns we would tend to gravitate to these firms or others with similar financial metrics.


