


 Some analysts are explaining the fact that crude oil prices have risen to triple digit price levels as a result of the ‘fear premium’ attached to concerns about future oil supply disruptions. But the facts indicate a fundamental mismatch of supply and demand can explain crude oil pricing, even without adding the ‘risk premium’ associated with potential disruptions.
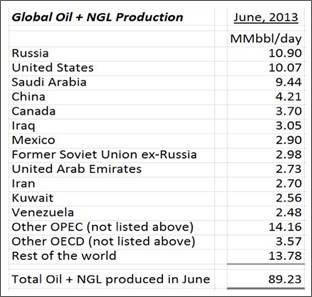
Examining global production of ‘black oil’ and ‘natural gas liquids’ (NGL) we find that total production is around 89.2 million barrels per day, well short of the 91 million barrels per day demanded by the global markets (chart at right courtesy the Houston-based Energy Prospectus Group).
The difference in demand and supply is made up from inventories. Demand usually peaks in the second half of the year since it includes a busy summer driving season, an increase in oil use to power electrical plants in the Middle East, and the ramping up of the production of heating oil for the upcoming winter season. Current crude oil supply and demand levels will most likely support triple digit crude oil prices for the remainder of 2013.
The boom in supply from horizontal wells drilled into U.S. shale formations has pushed the U.S. to near the top of the production chart with the U.S. producing more than Saudi Arabia! A large share of the recent gains in U.S. production are from NGL’s which are associated with natural gas production.
A fact that is rarely discussed by experts is of the top dozen global oil producers the United States is one of the very few countries that allows the private ownership of mineral rights and oil reserves – in other countries the minerals and reserves are owned by the state. This allows the capital market to quickly respond to oil or gas price swings in the energy sector – and allows individual investors to invest directly in the energy sector.
Investment Thesis - From an investor’s standpoint the bottom line is that global demand growth for crude oil is relentless. Supply is falling short of demand even without any additional production disruptions. Privately owned reserves in the ground in politically secure areas should increase in value – and reward shareholders. Owning companies with lots of proven and potential domestic oil reserves can be a pretty darn good investment these days.
Add into the mix some of the uncertainties involved in the demand and supply equation, and energy investors could harvest substantial excess returns. Demand and supply, and the investment implications, are discussed in detail below.
Global Crude Oil & NGL Demand Forecasts
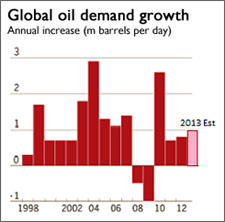 IEA Crude Oil Demand Forecast – The International Energy Agency (IEA) last month left its 2013 oil demand growth forecast unchanged, forecasting global demand will increase by 0.9 million barrels per day to 90.8 million barrels a day. For 2014 the IEA forecasts that global demand will increase by 1.1 million barrels per day to almost 92.0 million barrels per day.
The IEA also forecasts that global demand is likely to increase by at least a million barrels per day each year from now through 2040. When you combine increasing demand with the steady production decline (depletion) from existing wells we need to add approximately five million barrels per day of new production each year just to stay even! That is a tall order, even with the modern horizontal drilling and hydraulic fracturing technology.
Global demand for crude oil correlates very closely with economic growth. Next year the IEA expects the global economy to grow by roughly 3.8%. Except for several years around the Great Recession the growth in oil demand has been relentless. It is noteworthy that demand is increasing in 2013 and is projected to increase in 2014 even with crude oil prices above 0 a barrel – price levels which should moderate demand.
OPEC Crude Oil Demand Forecast - The Organization of the Petroleum Exporting Countries (OPEC) updated their oil demand forecast last month and re-affirmed their prediction that global oil consumption will increase by 1 million barrels a day in 2014. They also revised their world oil demand growth forecast for 2013 predicting demand will grow by around 0.8 million barrels per day, mainly based on actual and preliminary data for the first half of the year. The OPEC forecast was very similar to the IEA’s – both organizations forecast record global demand levels will be set in 2013 and again in 2014.
EIA: China Leading Oil Importer – The Globe & Mail reported last month that China is poised to overtake the United States as the world’s leading oil importer in October, part of a long-term trend. Chinese crude imports will exceed those of the United States for the first time on a monthly basis in October, and for the entire year in 2014, according to a U.S. Energy Information Administration (EIA) report. “The imminent emergence of China as the world’s largest net oil importer has been driven by steady growth in Chinese demand, increased oil production in the United States and a flat level of demand for oil in the U.S. market.”
[Hear More: Joseph Dancy: Global Demand For Oil Is Growing Relentlessly]
Global Crude Oil & NGL Supply Issues
Marginal Cost of Development Rising - A recent study of the 50 largest energy companies, which included the National Oil Companies, revealed that the marginal cost of finding and developing new oil production is now over a barrel. If oil prices decline much below this level for any length of time expect exploration activity to quickly decline. Add in the large production decline curve for most new horizontal wells and supply will quickly come into balance with demand should drilling activity slow. Relentless demand growth, with high priced marginal new production, means that owning companies with a lot of proven and potential domestic oil reserves should be attractive from a risk/reward basis.
EIA Note on Unplanned Outages & Spare Capacity - Unplanned outages cut world oil supplies by 2.8 million barrels a day in August, up from 2.6 million barrels a day in July, according to a report by the U.S. Energy Information Administration (EIA). Further, the report noted that “total unplanned disruptions towards the end of August are significantly above their monthly average level”.
The agency noted that the disruptions are occurring when the world’s spare oil production capacity is relatively low, around 33% below the average for the 2010-2012 period, a situation that could result in price spikes should unexpected disruptions occur. Here is a quick look at some of the areas experiencing supply issues:
Libya – One of the ongoing issues in Libya is the lack of governmental structure. Local interests are focusing on gaining control of government assets and revenues. Some analysts have gone as far as to claim we are “currently witnessing the collapse of state in Libya, and the country is getting closer to local wars for oil revenues” (from a report by the Swiss-based group Petromatrix). There is a sense of lawlessness evolving in Libya as militias have interfered with pipelines, storage facilities, and transport vessels. The country appears to lack the resources or authority to deal with the situation.
Export problems, including the closure of Libya’s two main crude oil export terminals, have reduced Libya's output to just 200,000-300,000 barrels per day compared to the country's production capacity of 1.6 million barrels per day (representing over 1.5 percent of the global oil output). Libya’s Waha Oil Company has halted its 340,000 b/d of production as tanks at the export terminal are full and strikers are keeping the terminal closed. The Libyan military has warned it may use force to open the export terminals and to remove strikers.
If strikes in Libya continue some analysts see oil prices heading well above the 0 a barrel level for Brent. To compound the problem, Libya’s oil is some of the highest quality produced in the Middle East and the kind preferred by European refiners.
The loss of Libyan oil production could be the “real price driver” in crude markets according to a research note from Vienna-based JBC Energy. Note that the supply interruption is not fully reflected in the Energy Prospectus Group production chart on page one of this report - so the demand/supply balance is more bullish than reflected in that data.
Iraq - Exports from Iraq are also facing difficulties. Militants have repeatedly bombed a major pipeline carrying oil from northern Iraq to Turkey cutting exports by at least 40%. Exports have been stopped for days as the line is repaired according to officials from the North Oil Company. The bombings are becoming so frequent that little oil can be transported lately. Iraqi exports from Ceyhan averaged 218,000 b/d in the first seven months of the year. The pipeline's capacity is of about 670,000 barrels per day. Actual exports are falling well short of capacity.
Iraq’s second problem is a round of maintenance work on southern export facilities that the IEA says is likely to curtail Iraqi exports by 500,000 b/d for four to six months starting in September. The Basrah port complex in the south supplies 2 million barrels per day to the export market. Iraq noted that they may delay the maintenance work due to the tight energy markets.
Making the situation worse conflict between Iraqi Sunnis and Shiites has returned to levels last seen in 2008. Iraq is close to civil war with almost daily bombings. The country still has not adopted a hydrocarbon law setting out the rights of the parties to development and production revenues. Should the violence and pipeline bombings spread to the southern complex substantial export volumes may be removed from the global market.
Syria - Syria has not been an active player in the oil market since 2011. Sanctions and instability have created turmoil in the economy and in the industry. Syrian oil production peaked at 596,000 barrels per day in 1995, falling to 332,000 barrels per day in 2011. Production is now estimated at 50,000 barrels per day or less, which is almost sufficient to meet domestic demands.
The concern with Syria is not a disruption in their exports, but what a recent report by Societe Generale refers to as “spillover” from any third party strike. They are concerned about Iraq, where violence is getting worse, and where the fighting in Syria has a parallel:
Our big worry is Iraq. The Sunni vs. Shiite conflict in Syria has a direct parallel in Iraq, and the violence in Iraq has reached levels not seen since 2008. For oil, the northern pipeline carrying Kirkuk grade to Ceyhan, Turkey in the Med has been repeatedly attacked for the last 2-3 months, reducing exports from 350 kb/d to under 200 kb/d (on average). Our concern is that the oil-directed attacks move south and potentially disrupt the 2 Mb/d of Basrah grade exported through the Basrah port complex on the Persian Gulf. There are signs that the non-oil violence (bombings, etc) may be moving south, and oil-directed attacks may follow. Iran, who is Syria’s only state ally in the region (Hezbollah and Russia are Syria’s other allies), may choose to stir up such attacks, in order to hurt the economies of the Western countries by causing an oil price spike.
The report was written by a former oil analyst for the US Central Intelligence Agency and an expert on geo-strategic issues. If missile strikes lead a regional spill-over, retaliatory attacks by Iran on Iraqi oil supply lines is the chief risk, with the report forecasting short term oil spikes to 0 per barrel. Even without ‘spillover’ they forecast that Brent could gain another -10, surging to 0-5.
Nigeria – Production this summer is at 1.9 million barrels per day, which is down from an average of more than 2.5 million barrels per day last year. This is the lowest output Nigeria has seen since 2009. Much of the decline is due to oil theft and disruption to pipelines and gathering equipment. On top of the theft issue and the lack of security for energy infrastructure, oil companies are at odds with the Nigerian government over a proposed plan to increase taxes for foreign investors to around 75 percent of oil profits.
Egypt – Egypt no longer exports oil because its 700,000-bpd production is hardly sufficient for its own use. But the Suez Canal and the Suez Mediterranean Pipeline (Sumed) are major routes of Arabian Gulf crudes to international markets and any negative impact on their operations could send oil prices soaring. Between them the two routes carry about 3.8 million barrels a day and Sumed is working below capacity. It can therefore be boosted in any supply emergency to the Canal.
Last weekend an armed attempt to disrupt shipping targeting a container ship in the Suez Canal was ‘foiled” by the Egyptian military, however the fact that an attack was even attempted will probably boost insurance rates and the cost of transport for traffic using the canal.
Investment Implications
The market for crude oil is global in nature. Relentless demand growth in the face of supply interruptions, with a limited amount of spare production capacity, paints a bullish long term picture for crude oil prices. The individual and individual investor in the United States has the unique ability to own mineral rights, including oil and gas in the ground, unlike almost every other country on the face of the earth. In a bullish environment proven reserves, especially oil reserves, should be a very attractive investment.
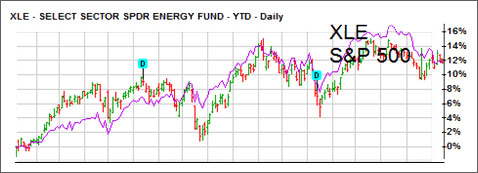
Largecap E & P Sector – Since the first of the year the large cap exploration and production sector has pretty well tracked the S&P 500 index. As measured by the S&P Energy Select Sector Index exchange traded fund (‘ETF’ symbol: XLE) both indexes are up roughly the same amount. ExxonMobil is the largest holding of the S&P Energy Select ETF. The average market capitalization of the holdings in this large cap exchange traded fund is 3 billion – these are very larger firms.
Smallcap E & P Sector – Earlier in the year we noted how the small cap exploration and production sector had lagged the S&P 500 index. Over the last several months the small cap exploration and production stocks have recovered and outperformed – at least as measured by the Powershares S&P Smallcap Energy Portfolio exchange traded fund (‘ETF’ symbol: PSCE).
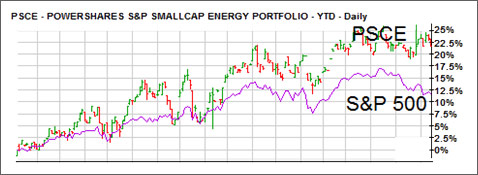
The average market capitalization of the holdings in this small cap exchange traded fund is .7 billion – these are clearly ‘small’ energy firms but not ‘microcaps’.
Microcap E & P Sector – Due to the lack of liquidity no public microcap ETF exists for the E & P sector, however Phil Juskowitz, managing director in the research department at Casimir Capital (a boutique investment bank), noted that as measured by the Casmir Microcap E&P Index the very small energy firms have ‘severely underperformed’ the smallcap indexes. The white line tracks the performance of the microcap index, while the yellow line tracks the smallcap energy index. Since the first of the year the smallcap index has gained around 23%, while the microcap index is roughly even (chart courtesy Casmir Capital).
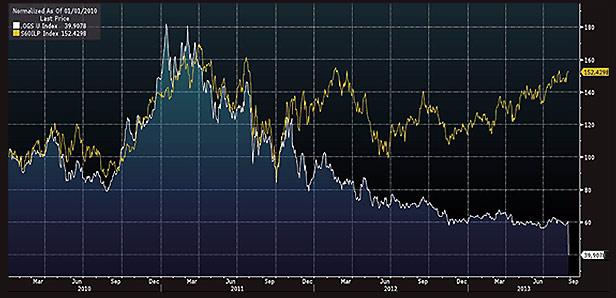
Due to the relative underperformance of the very small companies the concept of ‘reversion to the mean’ should apply, and investors may find attractive investment opportunities in the sector.
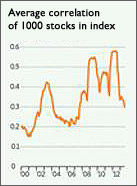
Correlations Declining – Another market development has very important implications for investors. Correlations have substantially declined with the performance of individual U.S. stocks are diverging from the indexes.
 Correlations measure how closely the returns of two investments follow each other. The closer a correlation value is to 1.0, the more similar returns are, while non-correlative assets have correlations close to zero.
During a market panic or bear market correlations among individual stocks rise towards 1.0 as the level of fear and discomfort rises. Investors sell everything rather than selectively look for opportunities. During bull markets, correlations among individual stocks fall.
The Wall Street Journal reported last month that "stocks in the Russell 1000 index of large-capitalization stocks had a weighted average correlation of 0.30 to the index itself, the lowest for an end-of-month since 2007 and down from 0.57 a year earlier, according to Deutsche Bank data" (see chart, courtesy Wall Street Journal).
When correlations decline the ability of analysts and investment managers to add value increases, since company by company fundamental analysis tends to be reflected in the stock price. In the energy sector firms with substantial proven reserves in the ground and growing production should provide investors with the opportunity to generate excess returns.
[Listen: Michael Kantrowitz: We're In the Very Early Innings of the Risk-On Trade]
Conclusion – Proven reserves in the ground in politically secure areas of the world should increase in value as violence and uncertainty in the Middle East continues with no quick solution in sight. Companies increasing production and reserves should be especially attractive, and due to their underperformance the smaller energy producers might be especially attractive.
Investors who have an interest in the energy and investment sector are welcome to join the “Michigan Tech / SMU Applied Portfolio Mgt Program - LSGI Trading Room” group on Linkedin that Professor Dancy established for his students and interested parties.


