


Executive Summary
- Market volatility picked up dramatically over the last few months. Was this a shot across the bow or a temporary disruption?
- Consensus views are for corporate earnings and economic growth to trough in first quarter 2019.
- We believe the consensus is premature in calling for a trough this quarter, which we believe lies further out.
- While US growth should continue to slow, likely bottom in global growth by the middle of the year.
- With dovish pivot by U.S. Fed, a weaker USD is likely and why EM equities and commodities could perform well.
Recent market volatility over the last several months has been surreal. We’ve gone from December 2018’s -9.2 percent decline in the S&P 500 representing the worst December since 1931 to January 2019’s 7.9 percent return representing the best January performance since 1976. Such a rapid turn of events begs the question, “Was it all just a bad dream?”
The answer to that question depends on what one believes were the ultimate causes of the decline and what the outlook is for 2019. If you believe the fourth quarter 2018 decline was largely due to an aggressive U.S. Federal Reserve and rising trade tensions between China and the U.S., then the fourth quarter nightmare was likely just a bad dream. However, if there are other forces at work, then we need to ask if the market’s rally off the December lows has gone beyond what the fundamentals would dictate, and is the market underappreciating other factors at play?
The Fed was a large part of the decline during the last few months of 2018. We pointed this out in our last article in which markets reacted widely to Fed speeches and press conferences. Part of the anxiety felt last year stemmed from the perception that current Fed Chairman Jerome Powell was more pragmatic than his predecessors as he was not an “academic,” being the first non-economist to hold the job as the Federal Reserve Chairman in over 40 years. Chairman Powell was also seen as more hawkish than his predecessors, Ben Bernanke and Janet Yellen, which was put to the test months into his career when the S&P 500 plunged more than 10 percent from its January 2018 high to its February 2018 low. Powell did not comment on the decline while his two predecessors were often more willing to pontificate on the undulations of the market in their speeches or go so far as to unleash gobs of liquidity in Bernanke’s case or put off planned Fed rate hikes in Yellen’s.
When the market plunged over 10 percent from its all-time high in September of last year, Powell’s right-hand man, Vice Chairman Richard Clarida, commented in early December that the market should not think the Fed was there to backstop a decline. Such thinking was only temporary as a further 10 percent decline from those levels exceeded the pain threshold for the Fed, leading Chairman Powell to make a complete pivot and not only go on pause regarding further rate hikes but to even mention that it would begin looking at ending its balance sheet reduction program.
The so-called "Fed pivot" has been met with cheer by financial markets. Adding more fuel to the equity fire is the ongoing work towards a China trade deal, helping markets back to where they were late in October and November of last year. With an aggressive U.S. Fed and trade tensions with China now moving into the rearview mirror, where do markets go from here? If U.S. economic growth and corporate earnings remain firm and the only real negative hits to the outlook for the stock market were an aggressive U.S. Fed and a trade war with China, then a new move to reclaim the highs set last year appears in the cards. That is not the narrative that we subscribe to for numerous reasons outlined below.
U.S. Economic Slowdown to Continue
One of the largest reasons why we do not feel new highs are around the corner is our expectation for the economy to continue to slow well into the summer, which will impact consumer spending and corporate earnings. Last year the U.S. economy saw real gross domestic product (GDP) grow at an annual rate of 2.9 percent, matching the high for the cycle set in 2015 and accelerating from 2017’s 2.2 percent growth aided by Trump’s tax stimulus plan.
In our second quarter newsletter last year, we called for a growth slowdown ahead for the U.S. economy and it does appear that the fourth quarter was the high-water mark as quarterly real GDP peaked at 4.2 percent in the second quarter and decelerated to 3.4 percent and 2.6 percent in the third and fourth quarterly respectively. The economic deceleration that began in the second half of last year looks to have continued into this year as the Atlanta Fed’s real-time estimate for first quarter 2019 real GDP is coming in at a snail’s pace of 0.40 percent (click for link) while the New York Fed’s real-time estimate comes in at 1.4 percent (click for link).
Most economists are expecting a re-acceleration after a likely poor showing for economic growth this quarter, but we believe that economic growth will continue to disappoint as we do not yet see a trough in the current slowdown based on the message from our leading economic index (LEI). The U.S. LEI we developed is based on data from the manufacturing and service sectors as well as housing and employment. It typically leads the Conference Board’s LEI and has yet to show any hint of a trough. In fact, our LEI recently plunged into negative territory with the lowest reading seen since the 2007-2009 Great Recession, which does not bode well for the U.S. economic outlook.

What is particularly troublesome is that this move into negative territory by our LEI is occurring in the context of the U.S. economy being quite late in the business cycle. We created our Business Cycle Index to help aid us in determining where we are in the business cycle with the following phases defined below:
1. Early Expansion/Recovery: Between 0-30
2. Middle Expansion: Index is rising and between 31-70
3. Late Expansion: Index is rising and > 70
4. Early Contraction: Index is falling and > 70
5. Late Contraction/Recession: Index is falling and between 31-70
At our current reading of 97 we are clearly late-cycle and investment risk rises materially as we move further into the business cycle. Now is not the time to throw caution to the wind and take a sanguine outlook as recession soon follows when our business cycle index turns down.

In the table below, we show the S&P 500’s forward returns at various levels of the business cycle broken up into five segments. The market’s cumulative return out 12 months, 24 months and 36 months is greatest at the beginning of the business cycle and diminishes as it progresses. This is shown in the table below which looks at the S&P 500’s forward returns when our business cycle index is rising. When we are in the upper quantile, the market’s 12-month forward return has averaged only 1.0 percent but turns negative when we look out two-three years.
S&P 500 Forward Returns When The FSWM Business Cycle Index is Rising

It is for this reason that we have maintained a defensive posture for our clients. We feel the market’s risk/reward outlook is not favorable and risks to the U.S. economy continue to mount as cracks are beginning to appear as are recessionary concerns. These cracks are summarized in the bullet points below:
- Labor Market: Continuous jobless claims last month hit their highest level in 11 months. February’s 20,000 payroll gain was the weakest since September 2017.
- Bank Lending: Auto delinquency (+90 days delinquent) rates are highest since April 2012. More than seven million Americans are delinquent on their auto loans, surpassing the peak set in 2010 (click for link). Delinquency rates on consumer loans are at their highest rate in five years.
- Housing:
- Price changes: New home sales median annual price change in November of 2018 showed a decline -11.6 percent, the steepest decline since 2009 due to faltering demand. Existing home sales median annual sales price for December 2018 showed the slowest appreciation since 2012.
- Sales: Total existing home sales are at their lowest level since November 2015.
- Manufacturing
- ISM manufacturing PMI hit the lowest level since November 2016 – evidence that the U.S. isn’t isolated from the weakening global-growth picture abroad, continues to be a poor backdrop for U.S. manufacturing in 2019.
- Retail Sales: Annual retail sales growth has plunged from a high of 6.3 percent in May 2018 to a low of 1.2 percent in December 2018, the second slowest growth rate of the entire expansion.
One of the recent economic developments that has caught our eye is the signs of a bottom forming in continuing jobless claims. Jobless claims are a canary in the economic coal mine as they consistently bottom prior to the onset of a recession as seen by the chart below where recessions are shown by the red vertical bars.
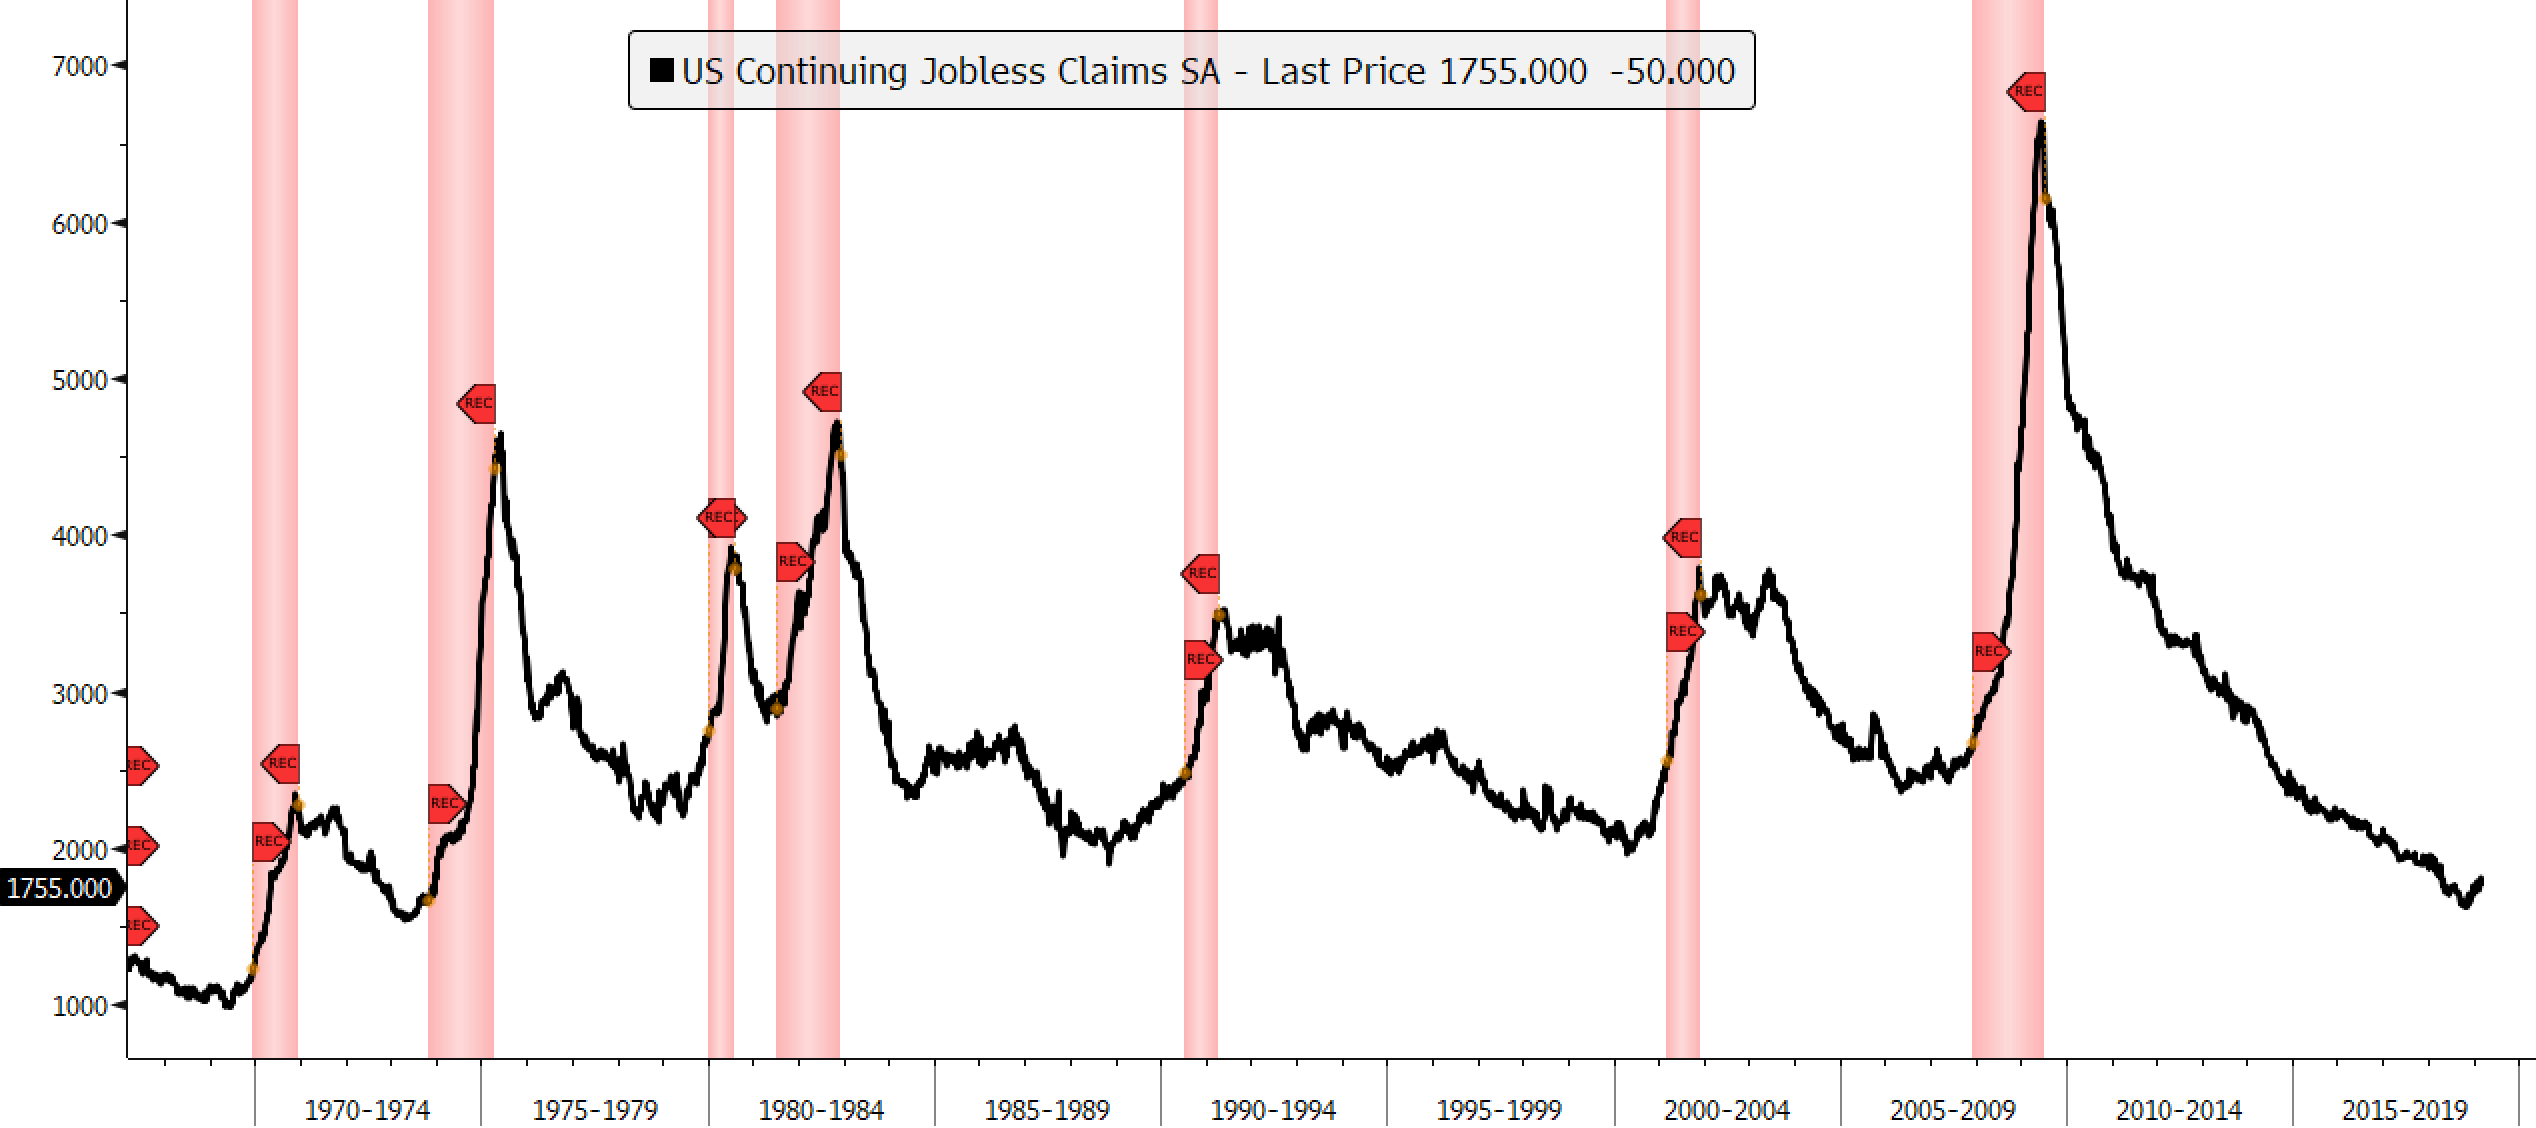
Looking at recessions since the late 1970s and treating the 1980 and 1981 recessions as one long recession shows that continuing jobless claims bottom on average between 16-17 months before the onset of a recession. Should the low set in October of 2018 hold, we could be staring at a recession in the first half of 2020, something that clearly bears watching.
U.S. Joins Global Growth Slowdown
We’re all familiar with the narrative of an aggressive Fed and a trade war with China behind the fourth quarter decline in the U.S. stock market. There’s also the analogy of the current decline and the one we experienced in 2016, which laid the foundation for the strongest period of global synchronized growth since we came out of the 2007-2009 Great Recession. We argued against this comparison in our January letter as we had yet to see a bottom in global economic activity. This is still the case and yet the comparison in the investment community remains despite continued economic downgrades. Just last week we saw the European Central Bank (ECB) slash its 2019 and 2020 outlooks to justify delivering a fresh round of monetary stimulus to help slow the economic decline of the eurozone.
ECB Injects More Stimulus as Draghi Reveals Slashed Forecasts
The European Central Bank delivered a fresh round of monetary stimulus in a bid to shore up the weakening economy as it cut its growth forecast by the most since the advent of its quantitative-easing program four years ago.
ECB President Mario Draghi said the euro-zone economy will now expand only 1.1 percent this year, a drop of 0.6 percentage point from forecasts just three months ago. A package of assistance from new loans for banks to a longer pledge on record-low rates is intended to expand existing stimulus, he said…
The announcement by the ECB last week came quickly on the heels of the OECD report in which the organization downgraded its global growth outlook again and raised the alarm for further deterioration.
OECD Cuts Global Outlook Again and Warns Worse May Be Ahead
“The global expansion continues to lose momentum,’’ the Paris-based Organization for Economic Cooperation and Development said as it downgraded almost every Group of 20 nation’s economy. “Growth outcomes could be weaker still if downside risks materialize or interact.”
The OECD’s numbers are more downbeat than the IMF’s for many economies, particularly the euro region and the U.K., as the organization warns that things could get worse…
The OECD outlook goes against hopes that sources of weakness at the end of 2018, including lower confidence, would prove temporary. That creates a headache for policy makers who may now need to find more combative solutions with limited room for maneuver on the fiscal and monetary side.
Confirming the downbeat outlook from the ECB and the OECD is a report from Bloomberg Economics that shows its current global GDP tracking estimate has yet to turn around.
Global Economy Hits Its Weakest Spell Since Financial Crisis
The global economy’s sharp loss of speed through 2018 has left the pace of expansion the weakest since the global financial crisis a decade ago, according to Bloomberg Economics.
Its new GDP tracker puts world growth at 2.1 percent on a quarter-on-quarter annualized basis, down from about 4 percent in the middle of last year. While there’s a chance that the economy may find a foothold and arrest the slowdown, “the risk is that downward momentum will be self-sustaining,” say economists Dan Hanson and Tom Orlik.
The bullish comparison of the 2016 global upturn to present is premature as economic data in most global economic regions years back turned up prior to the bottom in global equities which supported the rally in risk assets. However, as clearly illustrated by Citigroup’s Economic Data Change Indices, there is no visible upturn in any major geographic economic region to support the rally in risk assets that we have seen in 2019.

The Economic Cycle Research Institute (ECRI) has a long track record of accurately predicting turns in the U.S. and global business cycle. While every economist was drinking the global synchronized growth Kool-Aid at the start of 2018, they predicted a sharp slowdown in global growth as early as October 2017 (See, “Global Growth Outlook Darkens”). Given their early and accurate warning of a global slowdown, their current outlook should be given serious consideration. Are they in the global recovery camp and drawing the comparison to the 2016 upturn? Not at all as the following report from ECRI last month illustrates.
ECRI Indexes Lead Global PMI
ECRI’s sequential leading indexes helped us correctly forecast the current slowdown a year ago. Please recall that this was when the Global PMIs were around their highs for the cycle. In retrospect, it is now clear that the Global PMIs were just starting to peak, but it then took clear declines in the PMIs for the consensus to catch on to the reality of the global industrial slowdown...
Today, while the current downturn is not yet over, ECRI is keeping a sharp eye for any signs of the next cycle upturn.

Today, while the current downturn is not yet over, ECRI is keeping a sharp eye for any signs of the next cycle upturn.
Investment Strategy – Where Do We Go From Here
After major stock market declines there is typically a period of indigestion in which the market finds its footing and begins the process of forming the foundation of a bottom before advancing. Throughout the current bull market, we have seen major declines followed by a period of consolidation before a new, sustained rally took place. We saw this after the sharp correction in 2010 as well as the mini-bear market of 2011.

During the steep 2015 and early-2016 corrections the market retested the initial lows before resuming its march higher and took a couple of months to form a solid bottom.

Looking back even further to prior bull markets, there is a pattern of the market retesting its initial lows during sharp selloffs in an ongoing bull market. Other famous examples include the 1987 stock market crash where the S&P 500 fell more than 20% into the October 1987 bottom and was retested in December of that year before the market began to crawl higher (top chart below). We also saw a similar pattern where the market fell more than 20% in 1998 as Long-Term Capital Management lost $4.6B in less than four months, which ultimately required the Fed to step in with emergency measures. In response, the markets briefly headed even lower than the initial September low before finally heading higher (bottom panel below).

The process of forming a bottom after a steep correction has not taken place after the December 2018 lows, rather just the opposite has occurred. The rally in the S&P 500 over the first 45 trading days since the December lows has been straight up and has been the sharpest rally seen over 45 trading days since the 2009 bear market lows as the economy was emerging from a recession. In fact, going back further the next occurrence of such a sharp rally occurred as the U.S. was exiting the 2001 recession.
If we are correct that the stock market has rallied beyond what fundamental and economic realities suggest, then we are likely to see the market cool off in the coming weeks and months until there is greater visibility of an economic bottom in the global economy as well as U.S. economy.
One of our strongest investment convictions over the coming months is a significant top in the US Dollar (USD). A peak in the USD is likely to form this year as the economic growth premium the U.S. has witnessed over the last two years to the rest of the world, due in large part from Trump’s tax stimulus, is likely to reverse as global growth stabilizes and U.S. economic growth continues to cool. Peaks in the USD are typically associated with outperformance of foreign equities relative to the U.S. as well as stronger returns in foreign currencies and commodities. The recent Fed pivot away from expecting two rate hikes in 2019 to none will clearly pressure the USD lower.
A lower USD will be a continued boon to emerging markets (EM) as many EM countries borrow in dollars. Additionally, stronger EM currencies will help to cool their local inflation rates and provide relief both to their consumers and corporate profit margins as input costs stabilize. While a weaker USD will likely be a positive catalyst for EM countries, the missing and key ingredient for sustained gains in their equity markets will be stabilization in global growth.
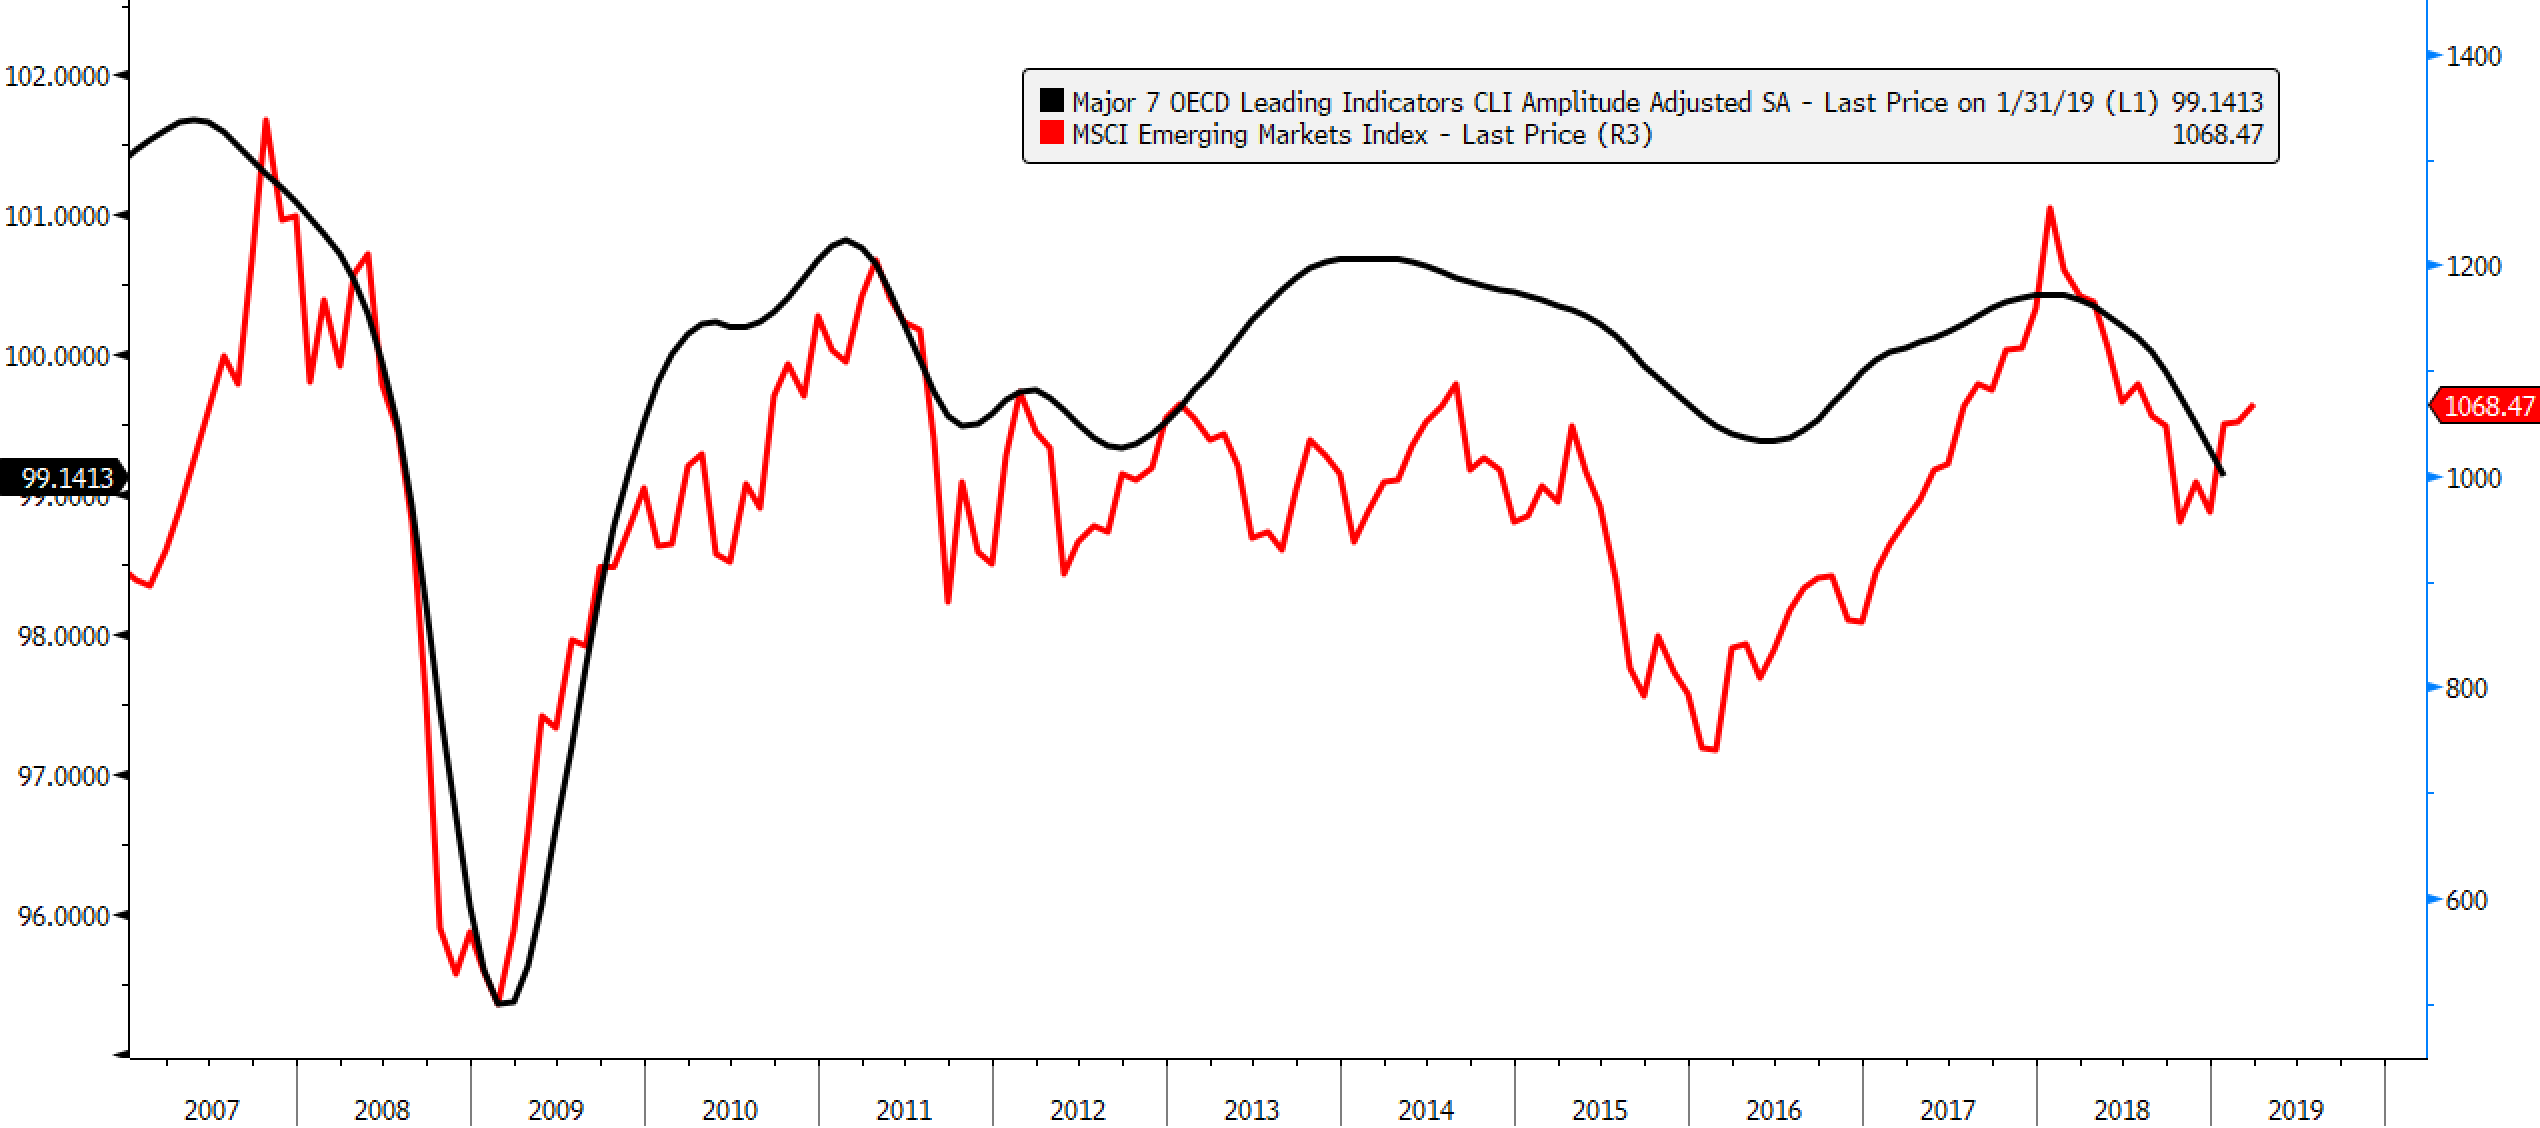
On that point, the OECD Leading Indicator for the largest 7 economies has yet to stabilize. EM equities tend to correlate with trends in growth for the global economy so the current rally in EM equities could be at risk if the stock market is discounting an economic turnaround that does not materialize. The correlation between global growth and EM equities is shown below.
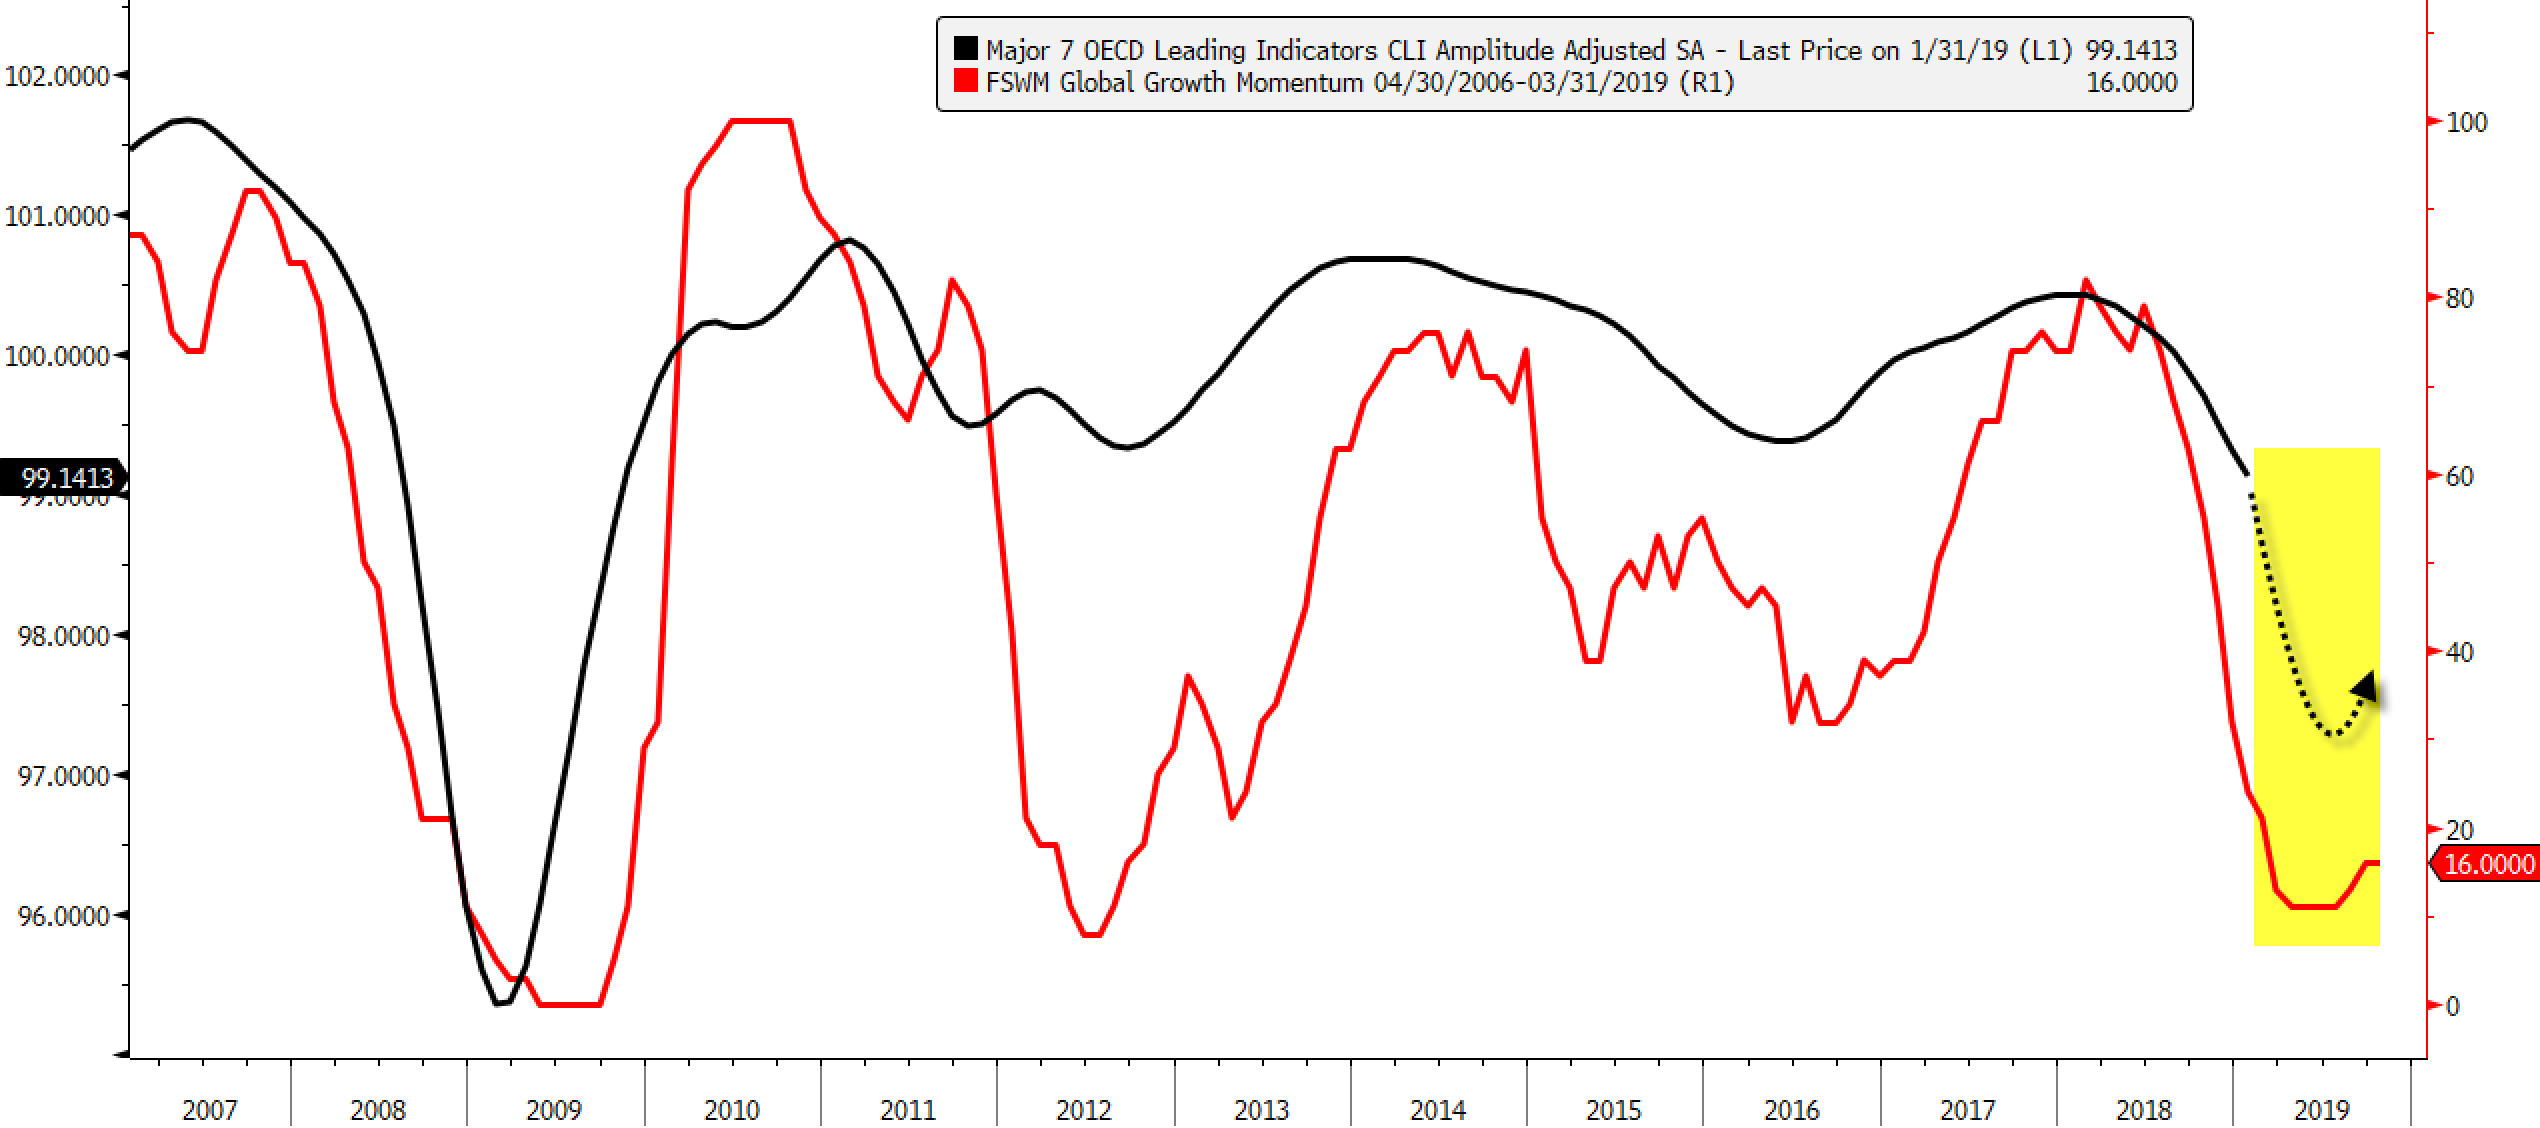
We are beginning to see some light at the end of the tunnel for global growth as our proxy for global growth is starting to turn up and suggests that a trough in global growth will likely occur in Q2 with a slight uptick in Q3.
In addition to EM equities likely performing well in the months ahead, we are also likely to see commodities in general, and the companies that produce them, benefit from the same two catalysts: stabilizing global growth and a weaker USD, with copper likely presenting an interesting opportunity. Currently, copper inventories are at their lowest levels since the Great Financial Crisis of 2008 and any pickup in global economic growth may push copper prices higher.

One additional area that likely stands to benefit from the Fed being on hold is gold. The price of gold put in a multi-decade low in 2001 at just under $260/ounce after former Fed Chairman Alan Greenspan began cutting interest rates in response to the 2001 recession and rose to over $400/ounce when Greenspan made his final rate cut. In the last cycle, gold rallied over 50% from the middle of 2007 into early 2009 as former Fed Chairman Ben Bernanke was slashing interest rates.
Our belief of a significant top in the USD stems from the Fed progressively pivoting from an interest rate hawk (tighter policy stance) to an interest rate dove (looser policy stance) with the first step being a cessation of its interest rate hike program. The next progression for the Fed to respond to a weakening U.S. economy is an end to its balance sheet reduction program, which it will do by September of this year followed by an eventual interest rate cut. The futures market as of 03/21/2019 is currently pricing in a 48.2% probability that the Fed will cut rates at its January 2020 meeting as economic projections for 2020 GDP are expected to come in even lower than 2019 estimates.
Summary
The current consensus view is that the nightmare seen in U.S. equities in the fourth quarter of 2018 was just a bad dream largely caused by an overly aggressive Fed and rising trade tensions between the U.S. and China. With both of those sources of stress on the markets behind us, the stock market continues its advance that was abruptly halted last year. A major catalyst to fuel further market gains, many believe, is a replay of the 2016 bottom in stocks in which a global growth downturn ended and was followed by strong synchronized growth. The bottom in global growth began in late 2015 and was already beginning to turn up in early 2016 when markets bottomed. Currently, markets have rallied strongly AHEAD of an upturn in global economic growth and is why we believe much of the strength in U.S. equities looks overdone. In our view, a period of cooling appears likely in the months ahead until the markets rosy belief for the outlook turns into reality.
US stock markets are not that far off their highs set last year while EM and developed foreign equities are still well off their highs and present a better value proposition. While the global slowdown that began late in 2017 is very mature and showing signs of a bottom in the middle of this year, the U.S. slowdown that began late last year may have a longer runway ahead of it. Thus, despite a more dovish Fed on our hands, the U.S. economy is likely to disappoint and is one reason why investors are likely to find better returns and value looking abroad.
More attractive opportunities will likely be present in investments that stand to benefit from a weaker USD such as foreign stocks, commodity-producing stocks, gold, as well as deep-value stocks with cheap valuations and high dividend yields, particularly given the fall in global bond yields.
To find out more about Financial Sense® Wealth Management or for a complimentary risk assessment of your portfolio, click here to contact us.
Advisory services offered through Financial Sense® Advisors, Inc., a registered investment adviser. Securities offered through Financial Sense® Securities, Inc., Member FINRA/SIPC. DBA Financial Sense® Wealth Management.


