


Summary: The macro data from the past month continues to mostly point to positive growth. On balance, the evidence suggests the imminent onset of a recession is unlikely.
The bond market agrees with the macro data. The yield curve has 'inverted' (10-year yields less than 2-year yields) ahead of every recession in the past 40 years (arrows). The lag between inversion and the start of the next recession has been long: at least a year and in several instances as long as 2-3 years. On this basis, the current expansion will last well into 2018 at a minimum. Enlarge any image by clicking on it.
You may also like Bitcoin, Real Estate, and FAANG Stocks - Investment Manager Compiles List of World's Largest Bubbles

Unemployment claims are also in a declining trend; historically, claims have started to rise at least 6 months ahead of the next recession. Note that recent hurricanes had a short-term negative impact on economic data. In the past, growth has quickly resumed. Thus, jobless claims recently spiked higher after Harvey/Irma, as it also did after Katrina and Sandy, but recent claims are already at a new 40+ year low.

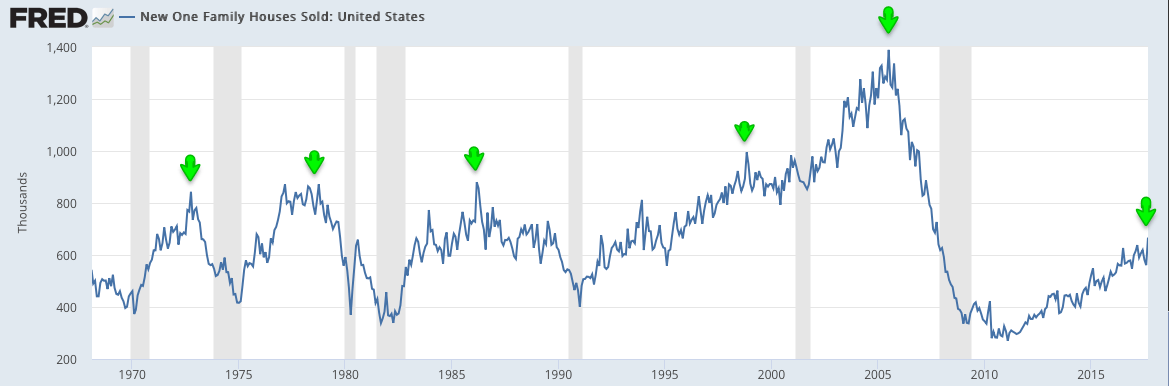
New home sales made a new 10 year high in September. In the past 50 years, more than a year has lapsed between the expansion's high print in new home sales and the start of the next recession.
There are two main watch outs in the monthly data that bear monitoring closely:
First, employment growth has been decelerating from over 2% last year to 1.4%, even before hurricanes Harvey and Irma. It's not alarming but it is worth noting that expansions weaken before they end and slowing employment growth is a sign of late-stage maturation in the current expansion.
A second watch out is demand growth. Real retail sales growth (excluding gas) was 1.6% yoy in September; growth was over 2% in 2016 and over 4% in 2015. Personal consumption accounts for about 70% of GDP so retail sales has a notable impact on the economy.
Here are the main macro data headlines from the past month:
Employment: Monthly employment gains have averaged 170,000 during the past year, with annual growth of 1.4% yoy. Employment has been been driven by full-time jobs, which rose to a new all-time high in September.
Compensation: Compensation growth is on an improving trend, growing 2.4% yoy in October. The 3Q17 employment cost index (2.6% yoy) grew the second fastest of the past 9 years.
Demand: Real demand growth has been 2-3%. In September, real personal consumption growth was 2.7%. Real retail sales (including gas) grew 2.2% yoy in September, making a new ATH.
Housing: New home sales grew 17% yoy in September to the highest level in the past 10 years. Starts and permits are flat over the past two years due to weakness in multi-family units.
Manufacturing: Core durable goods growth rose 7.3% yoy in September. The manufacturing component of industrial production grew 1.1% yoy in September.
Inflation: The core inflation rate remains near (but under) the Fed's 2% target.
Our key message over the past 5 years has been that (a) growth is positive but slow, in the range of ~2-3% (real), and; (b) current growth is lower than in prior periods of economic expansion and a return to 1980s or 1990s style growth does not appear likely.
This is germane to equity markets in that macro growth drives corporate revenue, profit expansion and valuation levels. The simple fact is that equity bear markets almost always take place within the context of an economic decline. Since the end of World War II, there have been 10 bear markets, only 2 of which have occurred outside of an economic recession (read further here).
The highly misleading saying that "the stock market is not the economy" is true on a day to day or even month to month basis, but over time these two move together. When they diverge, it is normally a function of emotion, whether measured in valuation premiums/discounts or sentiment extremes.

Macro data should continue to be better than expected in 2H17. Why? Macro data was ahead of expectations to start the current year. During the current expansion, that has led to underperformance of macro data relative to expectations into mid-year and then outperformance in the second half of the year (green shading). 2009 and 2016 had the opposite pattern: these years began with macro data outperforming expectations into mid-and then underperforming in the second half (yellow shading).

A valuable post on using macro data to improve trend following investment strategies can be found here.
Let's review the most recent data, focusing on four macro categories: labor market, end-demand, housing, and inflation.


