


Last month’s meltdown in the stock market began in earnest on February 2nd, the day that the January jobs report was released. The culprit, at least for the initial bout of selling, was an acceleration in wage growth – the initial estimate of average hourly earnings reached 2.9%, the strongest year-over-year gain since 2009.
This report, which came on the heels of two months of rising long-term interest rates (the 10-year climbed from around 2.36% to 2.85%) caused the market to panic. Investors immediately began to worry about rising inflation, which would then trigger a more hawkish Fed, and consequently more downward pressure on the economy than previously anticipated.
Don't miss Chris Puplava on Late-Cycle Investing Game Plan
We now know that some of the volatility we experienced was the result of leveraged trades being unwound, but more importantly, it appears that the catalyst for the selloff may have been overblown.
At the time, I pointed out that the spike we saw was primarily driven by wage gains for managerial workers. Wage growth for nonsupervisory workers (about 80% of the workforce) was not as robust.
Fast forward one month and it now appears that the story has changed. Not only did February’s wage growth show an overall deceleration, last month’s 2.9% growth figure was revised down to 2.8%, which matches the wage growth last seen in September of 2017. You can see this in the chart below, where the orange dot depicts the initial 2.9% reading that flustered the markets.

Since then, we’ve seen inflation expectations subside (evident by a drop in 5-year forward rates) while actual inflation remained subdued. Both headline and core CPI remained the same at 2.1% and 1.8%, respectively, in January, as did headline and core PCE (the Fed’s preferred measure of inflation), which came in at 1.7% and 1.5%, respectively.
This suggests that while the labor market continues to improve, worries about wage growth triggering a spike in inflation may have been overdone. That is not to say that higher inflation is no longer a concern, only that the market may have gotten ahead of itself.
The most recent jobs report, which came out last Friday, showed strong job growth (313,000 net jobs created), but importantly, it also showed a strong flow of individuals back into the workforce. In fact, last month over 800,000 Americans joined the labor force, the largest one-month increase in the labor pool since 1983.
Hear also Will Fed Rate Hikes Lead to an Out of Control Debt Spiral?
Wages, which represent the price of labor, are believed to react to basic supply and demand forces in the labor market. As the pool of available workers shrinks, competition for new hires increases, which generally results in rising wages. But one of the key questions now is how much “hidden” supply exists in the economy. Will more and more workers return to the workforce as the economy continues to improve? Or are we truly nearing what economists consider full employment?
One key to the puzzle can be found by looking at the U-6 unemployment rate, which includes those in part-time jobs or still too discouraged to seek work. This measure has been declining but remains elevated compared to the last time the headline unemployment rate touched 4% (8.2% now vs. 6.9% back in December of 2000).

This suggests that there may be more slack in the labor market than a 4.1% unemployment rate implies. If that’s the case, then it means companies have more room to expand before rising wages begin to eat into their profits. It also suggests that the Fed may not have to worry quite as much about rising inflationary pressures, meaning it can take its time raising short-term interest rates.
So for the moment, it appears that the market may have gotten ahead of itself with the February swoon. BUT let’s not forget the obvious, which is that the market needed a reason to correct. From the beginning of 2017 through the end of January 2018 (a period of 13 months), the S&P 500 provided a total return of nearly 30%. That type of growth is unsustainable, and after a surge like that, the market WILL find a way somehow to consolidate and work its way back toward the longer-term growth trendline.
Moving on, it’s important to note that the economy still remains on sound footing, and the behavior we’re seeing in the stock market is indicative of strong cyclical growth. First the economy …
As you can see in the chart below, courtesy of Yardeni Research, both the Economic Cycle Research Institute’s Weekly Leading Index, as well as The Conference Board’s Leading Economic Index, remain in sustained uptrends and at new highs.

This paints a bullish picture for the US economy and suggests that we remain in the midst of a strong upturn. Naturally, that bodes well for stocks, and we’re seeing that outlook reflected in the behavior of investors.
The following chart shows how various sectors of the market have performed, relative to the S&P 500, since the market bottomed on February 8th. In other words, it shows us which sectors investors have rushed in to buy after the major haircut the markets took in early February.

There are a few items worth pointing out here. First, notice that technology has truly been the outperformer. This is largely because of the strong earnings and revenue growth we’re seeing in tech, along with their purported relative insulation from the tariff mess.
Trailing behind the technology are financial stocks, which benefit from higher interest rates and an improving economy. Behind them are cyclical and industrial companies, which also thrive when economic growth is strong.
Finally, in the last place are consumer staples and utility companies. These firms are coveted when the economy is slowing, but are less desirable during periods of strong economic growth, as their revenues and earnings are less tied to the economic cycle. They're also rated sensitive sectors that tend to respond poorly to rising long-term rates, which often accompany strong economic growth.
Altogether, this points to a synchronization between what leading economic indicators and price action are telling us: namely, that the economy is poised for continuous growth.
This does not, however, mean that we’ll see an immediate rise in share prices. On the contrary, I think we may see a prolonged consolidation before the market as a whole feels comfortable moving above the late January highs. (The Nasdaq has already bettered those highs but the Industrials, Transports, S&P 500 and Russell 2000 have not.)
The last thing I’d like to point out is that market breadth remains strong. When the market peaked in late January, market breadth confirmed that action, and in the ensuing weeks we’ve seen market breadth recover nicely.
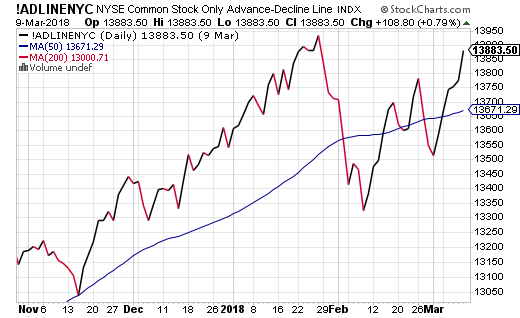
We’re still not yet back to new highs, but could be short. At the very least, this shows that the market does not have narrow leadership, a characteristic that often accompanies major turning points.
The preceding content was an excerpt from Dow Theory Letters. To receive their daily updates and research, click here to subscribe. Matt is also the Chief Investment Strategist at Model Investing. For more information about algorithmic based portfolio management, click here.


