


I had plenty of time for my talk at the conference “Peak Oil: fact or fiction?” held in Barbastro (Spain) on May 4-7 2011. So, I could ramble a little on various subjects, from the entropy of complex systems to the stoic philosophy of Emperor Marcus Aurelius (above). Perhaps too many things but, in any case, here is a version written from memory where I tried to maintain the tone and the content of my talk. I have added headings for clarity.

1. Simple physics and complex systems
So, ladies and gentleman, first of all let me show you this apple (photo by Daniel Gomez)

Don't worry; it doesn't mean that this will be a very long talk! I brought this apple with me just because I wanted to tell you about Newton's universal law of gravity. As we know, it seems to be true that he got the idea because he saw an apple falling from a tree (although it may not have fallen straight on his head!).
The fact that apples fall from trees - and that everything else that can fall, does - is an effect of the existence of relatively simple laws in the universe. Many things that we see around us are extremely complicated - or "complex". Think of the solar system, for instance. There are many bodies of different sizes, moving in different trajectories. But there is a certain logic in it and the logic comes from a very simple law - Newton's law - which can be expressed as follows:

Before Newton, for a long time scientists could only grumble something about “angels pushing” when asked about what caused planets to move. But if you know the law, you can describe not only the movement of the planets of the solar system, but all sort of bodies, including entire galaxies.
It is not rare to find an underlying simple law that generates complex systems. Think of fractals; Mandelbrot's set, for instance. Fractals are not just mathematical entities, are common in nature, as well. Or think of models such a Feigenbaum's bifurcations – they are the result of an extremely simple equation. These are examples of a class of systems that are relatively common in physics. Complex systems resulting from very simple laws. It is one of the beauties of physics that these systems exist.
Now, when we discuss of complex system, of course what comes to our mind is the subject we are discussing today – the economy and what makes it move. This is surely a very complex system and one of the problems economists have is that most of their models just don't seem to be working very well. Sometimes, economists seem to be still thinking of the "invisible hand" and that looks very much like the angels pushing planets of long ago. But astronomers are not thinking or angels any longer whereas economists.... well, let me not engage in economist-bashing.
2. Newton's apple in economics
So, let's see if we can inject some physics into modelling the economy. Can we find something equivalent to Newton's apple in economics? I think it is possible and let me show the observation that can give us the key that we need to understand how our economy works - considering that it is strongly based on non-renewable resources; crude oil in particular. So, here is this “apple” for crude oil, as Marion King Hubbert published it in 1956.

Note that Hubbert had only data until 1956, the rest is extrapolation. What this graph says is that he expected oil production in the US 48 lower states to behave in a certain way. Did it? Yes, as you can see in this image.

The agreement is impressive, considering that the curve spans several decades. But the main point, I think, is that oil production did follow a certain trajectory. There is a regularity, here. There is some kind of underlying law. And it is not angels – angels don't extract crude oil (for what we know, at least; one wonders what energy source they use in Paradise...). So, let me show the historical production data for Hubbert's case as we have them today. It is in Italian, but I think is easy to understand.

This graph emphasizes the “bell shaped” curve that production follows. Today, this curve is often know as “Hubbert's curve” and the maximum in production is the “Hubbert peak”. You have surely heard to it. When referred to world oil production, people say “Peak Oil” and we heard that term mentioned many times at this conference.
Now, I am telling you that this curve can be seen as the “falling apple” that gives us the key to understand the inner mechanisms of the exploitation cycle. Of course, before going on I have to convince you that this is a very general behaviour. All apples fall from trees in the same way and not just apples – also oranges and watermelons; just as do cats and dogs, planes and TV sets and whatever you can think of. Actually, not exactly everything – take a feather and you'll see that it doesn't follow Newton's law. But, of course, you don't jump to the conclusion that Newton's law is wrong; of course. It means that – in order to find the inner laws governing a system – you need to make sure that the system is not perturbed by effects that will cloud the effects you are studying. In the case of gravity, you must ensure that the effect of air doesn't affect too much the fall of an object. In the case of the Hubbert curve, you must make sure that government actions don't affect too much production. In other words, Hubbert's law works best in conditions of free market; when people can decide whether to extract oil or not depending on whether they think they can make money or not from the task.
3. The Hubbert law
This said, let me show you a few examples of Hubbert-like curves.

This one is the production of anthracite coal in Pennsylvania, one of the best examples we have of a Hubbert curve. I think it is from this graph that Hubbert got the inspiration to propose a similar curve for petroleum, although I am not aware that he ever mentioned this curve.

This is another example of a Hubbert curve, this time for a mineral not used for energy production: boric acid. These are data that I found just a few weeks ago. The curve is not a "perfect" Hubbert curve but, clearly, the trend is there.
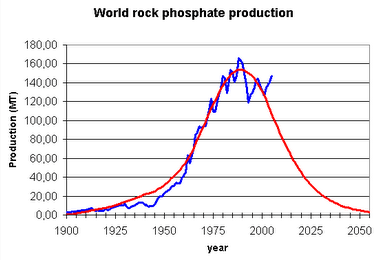
This is another mineral commodity, phospates (From Dery and Anderson). I am showing this one because phospates are a fundamental fertilizer used in agriculture. We could live without oil, but we cannot live without phospates. Here; the curve is not complete, but the tendency is rather clear.

And here you can see that the curve is the same also for commodities that are not thought of as "minerals", normally. The Saudis had been extracting "fossil water" from underground aquifers and, for a while, they kept a flourishing agriculture with this water. Then, it was over. Luckily for them, they can import food with the money they make selling oil. But their oil will not be eternal, either.

As a last example, here are the data for something that is not by any means a mineral resource. It is the production of whale oil (and whale bone, used for stiffening ladies' corsets). Even though whales do reproduce, they were hunted so fast that the cycle was the same as that of non renewable resources.
I think you see that there is a pattern; a logic; and this “bell shaped” curve does not appear just for oil, or energy resources. It is a very general pattern of production of non renewable resources (or slowly renewable ones, such as whales).
Before you interrupt me, I hasten to say that there are counter-examples, of course. Go see oil production in Saudi Arabia, for instance, and you will see no bell shaped curve. There are other examples. But the Saudis extract on very different assumptions than those of the commercial oil companies; short term profits are not their only objective. As I mentioned before, even for Newton's idea, there were counter-examples; a feather for instance. Here, the concept is that, when governments or dictators, or the Gosplan (the Soviet planning agency), do not intervene in ordering people what to do, the actions of investors and operators will be based on reasonably objective evaluations of what is convenient to do in economic terms. That evaluation, in turn, must be based on physical factors – so a free market may be expected to be strongly affected by physical reality.
4. Entropy and economy
So, I am asking you to follow me with this idea; that the bell curve is a “natural” behavior of production for non renewable or slowly renewable resources. With “natural” I mean that it is the way the system is expected to behave when there are no strong interferences from political or other kind of perturbations. Then, I said that we should look at the inner mechanisms that make the economy behave in this way. I believe that we don't need to invent a brand new law, as Newton did for gravity. We already have the laws we need – even though so far we failed to apply them to this case. These are the laws of thermodynamics. Here are the three laws in a simplified form:
- You can't win
- You can't get even
- You can't quit the game
That is, of course, very simplified! There are even simpler versions. For instance, for economists it would be just a blank slide (sorry, I said no economist-bashing!). Before going on, let me tell you that this is a new idea that is moving forward nowadays– the idea of applying thermodynamics to the economy. More exactly, to apply “non equilibrium thermodynamics” (NET) to the economic system. It is a work in progress. So, what I'll be telling you is still tentative, but I do believe that we are on the right track.
Now let me show you this image of a waterfall:

And now let me ask you a question: what makes water fall? You'll say it is gravity; and that is correct. But there is a deeper factor here – this movement is eventually generated by the laws of thermodynamics. Nothing escapes thermodynamic laws. It is a question that I ask to my students, sometimes: how do you explain that water flows down in thermodynamic terms. It is difficult for them to find the answer right away, and yet they have studied thermodynamics. So, let me tell you; water flows down because of the second law – the entropy one.
You may remember from your studies that entropy is related to disorder. In some senses, it is true, but it is a definition that creates a lot of confusion. Think of entropy as heat dissipation. Then, everything that happens in the world is the result of some heat being dissipated – entropy tends to grow. When water falls from a high reservoir, some heat is created. The water at the bottom is slightly hotter than the water at the top – energy must be conserved, so it appears in the form of heat. Slowly, this heat is dissipated to the surroundings and that is what drives the system: entropy increase. The law of entropy is the law of change. Things move because entropy can increase – otherwise everything would stay frozen as it is. An equivalent way of saying that is that things happen because potentials tend to equalize. In the case of a waterfall, we have a gravitational potential difference (or "gradient"). With crude oil we have a chemical potential difference. There are other kinds of potentials, but let's not go into that now.
Now, maybe it is not correct to say that something happens “because entropy must increase.” Probably, it is more correct to say that the universe behaves in a certain way and that it is convenient for us to describe this behavior with concepts such as “gravity”, “entropy” or “potentials.” These concepts are more useful than those involving angels pushing – or similar ones; such as the invisible hand.... sorry; no economist-bashing, I said. But, in practice, for these concepts to be useful I can't just tell you, “the economy moves because entropy must increase”. It is true, but we need to go much more in detail. In order to do that, we need some kind of formalism where we can change the parameters of the system and see whether we can reproduce historical data, for instance Hubbert's curve. That is what I'll be doing; showing you how Hubbert's idea can be derived from an interpretation that – ultimately – has to do with thermodynamics. But first let me introduce to you the method known as “system dynamics” which can be used to describe this kind of systems.
Let me show how system dynamics (SD) works by showing a description of a waterfall. Here, actually, it is about a bathtub, but the physics is the same.
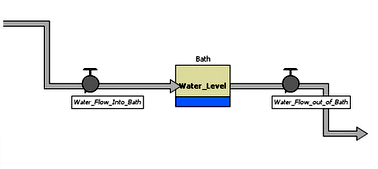
The model is made out of boxes, arrows and valves. Boxes are termed “stocks” and arrows are termed “flows”. If there are two boxes connected to each other, a stock may flow into another depending on the potential difference. In general, the concepts of potential or gradients are not so often used in SD. This is a shortcoming, I think. Anyway, I said that I wanted to make a model that describes the economy and produces the behavior that we have termed “Hubbert's”. In order to do that, a single waterfall is not enough. We need something just a bit more complex – like this three tiered fountain.

The driving forces in the water movement are the same as before – gravitational potentials. Now, this fountain is not the perfect model for what I am trying to do. Use it just as an illustration of the concept that it is a potential-driven system. For modelling an economy, we need a further step: the concept known as “feedback”. That means we have to assume that the flow from one stock to the other does not depend just on the size of the upper stock, but also on that of the lower stock. The model is now more like a biological model. Think of the lower stock “preying” on the upper stock and growing in proportion. Without feedback, we have no growth and the model does not define a real economic system. So, let's take this further step and describe the model using the convention of system dynamics.
Editor's note: Come back tomorrow for the conclusion in Part 2 of Entropy, Peak Oil, and Stoic Philosophy
Source: Cassandra's Legacy


