


Ask ten economists what causes recessions, and you’re likely to get fifteen different answers. Some will point to supply or demand shocks, policy errors, inflation, or sticky prices, while others, such as Hyman Minsky, will point toward fragility caused, oddly enough, by stability.
Each recession we experience is unique, and therefore, it’s not surprising that identifying the root cause can be an arduous task.
But all recessionary periods share some of the same characteristics, and we can examine these similarities to identify periods when the probability of an approaching recession is higher than others.
One very important piece to this puzzle has to do with inventories.
Recall that a recession is simply a contraction in the business cycle. It’s a period during which prior excesses in the system need to be worked off. These “excesses” often come in the form of inventory accumulation.
In fact, many economists point to excessive inventory accumulation as the most frequent cause of recessions in the post-WWII period. When inventories rise too high, we see a reduction in output that is accompanied by layoffs, reduced spending and a decline in production and productivity.
Podcast Shulyatyeva: Data Suggests Maturing Economic Cycle
It is during this period that prior excesses in the system (inventories) are worked off, allowing for the cycle to resume.
Take a look at the chart below to see this in action. This chart shows total business inventories by month, without any seasonal adjustments. (Interestingly, you can see the annual cycle of inventory accumulation in the repeated spikes in the chart. One could view these as smaller secondary trends within the primary trend).

In this chart, we can see that inventories have a habit of continually rising until the excesses get bad enough to where we see a pullback in investment and production. This leads to a contraction in our economy, aka recession.
We can also see that inventories have been rising steadily since 2010, indicating we may be getting close to a period in which those excesses must be worked off.
For another perspective on this same phenomenon, consider the chart below, which looks at business inventories in relation to business sales.
This inventory-to-sales ratio has been climbing since the beginning of 2012, and in recent years has moved considerably higher. In reading the chart below, the vertical axis measures how many months it would take for businesses to sell through their inventory.
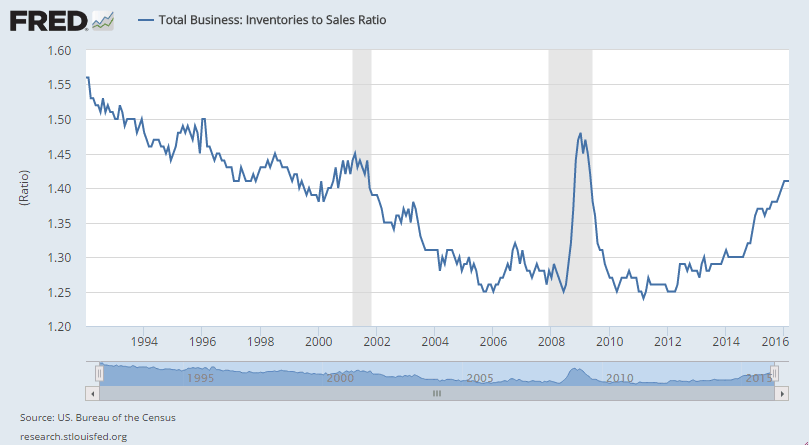
The upward move at the end of this chart stands in direct contrast to the trend that we saw from 1992 (the earliest year for which this data is available) up until the financial crisis. So what’s responsible for this major shift in trend?
There are a few plausible explanations, including one by Alan Greenspan in which he attributes the long-term decline in the inventory-to-sales ratio to increased efficiency of corporate supply chains.
Put simply, over the last couple of decades advances in technology and adoptions of philosophies such as Just In Time (JIT) deliveries (and many others) have enabled companies to run leaner. They don’t need as much inventory on hand to support sales because they’ve become much more adept at managing the flow of products into distribution centers and stores in relation to consumer demand.
If we were to accept that explanation at face value, it makes the recent rise in inventories all the more worrisome. But it also begs the important question: is this rise in inventories occurring because businesses cannot sell these goods? Or is it because they’re anticipating and preparing for a rise in demand?
Read Davidowitz: Retailers in 'Survival Mode' as Headwinds Multiply
Either way, higher inventory levels indicate more excesses in the system, which points toward reduced production going forward.
If you’ve been following my commentary for some time now, then you might question the ramifications of this inventory buildup, considering that I’ve previously pointed out that roughly 80% of US economic output comes from the service sector. Services don’t have inventory, so does that mean this development is unimportant?
Unfortunately, no. To understand why we have to look at two more charts.
Many people naturally assume that because consumer spending accounts for the vast majority of GDP (approximately two-thirds), we must see a contraction in consumer spending in order to have a recession.
Well … here’s a chart showing the growth rate of consumer spending, and as you can see, it was positive (though decelerating) going into the last two recessions.

So recessions can and do occur while consumer spending is rising. Now look at this next chart below, which effectively shows the growth rate in business spending.

Here we can see that the growth rate of business spending fell below zero prior to both of the last two recessions. This suggests that when businesses pull back, either because they see weakening economic conditions ahead or realize they’ve already produced too much, it sets the stage for a recession.
Notice also that the growth rate in business spending just hit zero once again.
None of this suggests that a recession is imminent, but it adds to the warning signs and further backs up our cautious stance with regard to equity markets.
Read also CFOs Say China, US Political Turmoil Pose Greatest Risk to Economic Outlook
Wrapping things up, I’ll leave you with one last chart. Below we can see The Conference Board’s Leading Economic Index in blue. I always follow this index due to its ability to recognize deteriorating conditions well before the onset of a recession.
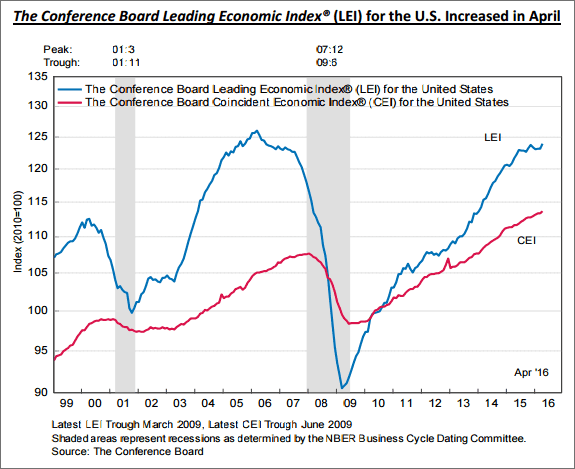
The latest release showed strong growth, with the LEI rising 0.6% in April. According to The Conference Board, “The US LEI picked up sharply in April, with all components except consumer expectations contributing to the rebound from an essentially flat first quarter.”
The uptick is comforting, but if we look at the chart of the LEI above, we see that its trajectory is beginning to flatten. Historically this index begins heading lower a year or more before the onset of a recession, so we’re not in dire straits yet, but it further supports a cautious view moving forward.
The preceding content was an excerpt from Dow Theory Letters. To receive their daily updates and research, click here to subscribe.


