


Summary
- The markets have stabilized since the August 7th low and put in “A” bottom
- Deterioration in breadth and momentum argue against a sustained move higher
- Markets may be sniffing out greater geopolitical risk and weaker economic growth ahead
- Despite any future weakness, a bull market top and recession are still unlikely
Back on August 5th I penned a piece, More Signs a Market Bottom is Forming, in which I made the case that “A” bottom was approaching but it was too soon to tell if it was “THE” bottom for the pullback since the July peak. At the time many questioned how we could have a bottom with the S&P 500 off less than 4% from its highs. A good question, but, like any doctor checking a patient, we can't see what's really going on just looking at the surface. For that, we have to examine the internal dynamics that most don't readily see. For example, the S&P 500 index is composed of 500 stocks and, upon closer inspection, we can see that there was far greater weakness within the market than the headline indexes suggested.
A good way to visualize this is by measuring how far off the average stock within an index is relative to the index itself (say, by using 52-week highs). Currently, the S&P 500 itself is less than 2% away from hitting a new 52-week high and yet of the 500 stocks within the index the average member is off by 8.3% despite the rally over the last few days. Looking at other indexes like the NASDAQ, which is less than half a percent away from a new high, shows the average member within it down 25% from its 52-week high. Clearly, there has been some technical damage done that isn’t readably visible by just looking at the index itself.
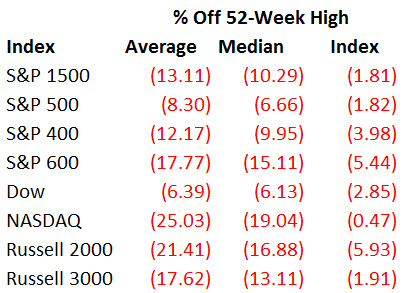
Source: Bloomberg
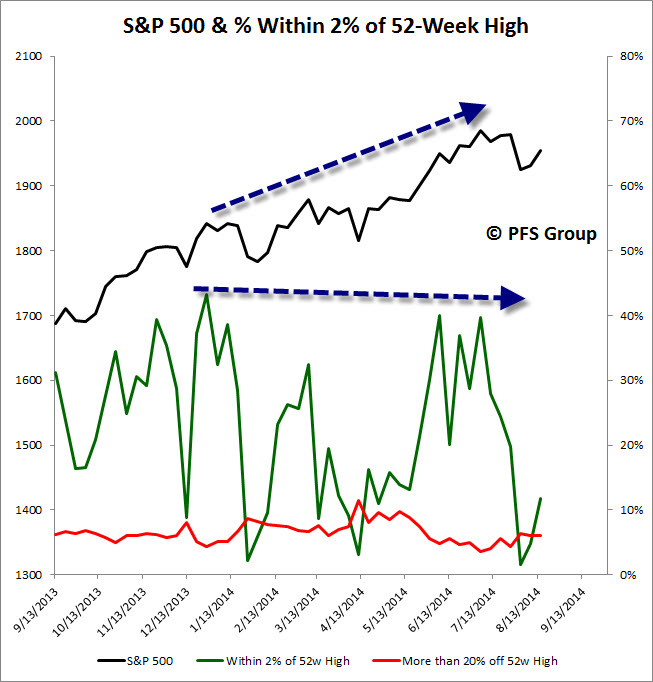
Looking at the data in a slightly different light I measure the percentage of members within 2% of their 52-week highs as well as the percentage of members in bear markets (down 20% or more) from their 52-week highs. Looking at the S&P 1500 which makes up about 92% of the entire US market cap and is composed of the S&P 500 large cap, S&P 400 midcap, and S&P 600 small cap members shows that there has been some subsurface deterioration in the markets. For example, as we were closing out 2013 and hitting new highs we typically saw roughly 30% of the indexes 1500 members within 2% of their own 52-week highs. What is alarming is that while the S&P 1500 had continued to march higher and hit new highs in 2014, the percentage of stocks within their own private bear markets has also been creeping higher as stock picking has been a crucial factor in performance for this year. Of note, the July 2014 peak in the markets was associated with fewer members near their highs than was seen at the December 2013 new high in the markets, setting up a negative divergence while the percent of stocks in bear markets hit a new high during the recent pullback. This highlights that investors are crowding out in the large cap stocks while smaller cap stocks are suffering larger losses.

Source: Bloomberg
This is made even clearer when breaking out the S&P 1500 into the S&P 500 large cap and S&P 600 small cap data. Looking at the S&P 500 shows a respectable 40% of the market was within a 52-week high as the S&P 500 was hitting new highs in July and, just as important, the percent of stocks in bear markets within the S&P 500 was in the single digits and not expanding.
Source: Bloomberg
The picture turns much darker when viewing the small cap S&P 600 and its members. The S&P 600 hit a closing high of 692.54 on July 3rd and at the time there were 15% of the 600 members within 2% of their 52-week highs. What is highly alarming is that at the same time there were 23% of the 600 members experiencing their own private bear markets. At the time the S&P 600 was hitting a new high, you had fewer members also at or near their highs than members in bear markets (red shaded bar below). What is also disturbing is that at the recent market low last week you had more than 40% of the 600 members in a bear market and this number continues to grow with every pullback in the index (see red arrow).

Source: Bloomberg
Another development I have been tracking is a loss in market momentum and, given a peak in momentum almost always occurs before a price peak, risk management should play a critical role for investors going forward. I track the percentage of members within the S&P 1500 on daily, weekly, and monthly MACD buy signals. Viewing the data shows that the monthly momentum of the market peaked last summer and despite the stock market powering higher we’ve seen fewer and fewer members on monthly MACD buy signals, which has eroded to the point where there are almost as many members on sell signals as buy signals—a clearly bifurcated market. There has also been a fair amount of erosion in the weekly numbers as well but given the current level near 30% on buy signals we’ve likely seen a temporary low as the markets tend to bottom with weekly numbers below 30%. Adding further support for a market bottom comes from RecessionAlert.com who show’s we’ve been given a “Once in a year opportunity” for a market bottom.
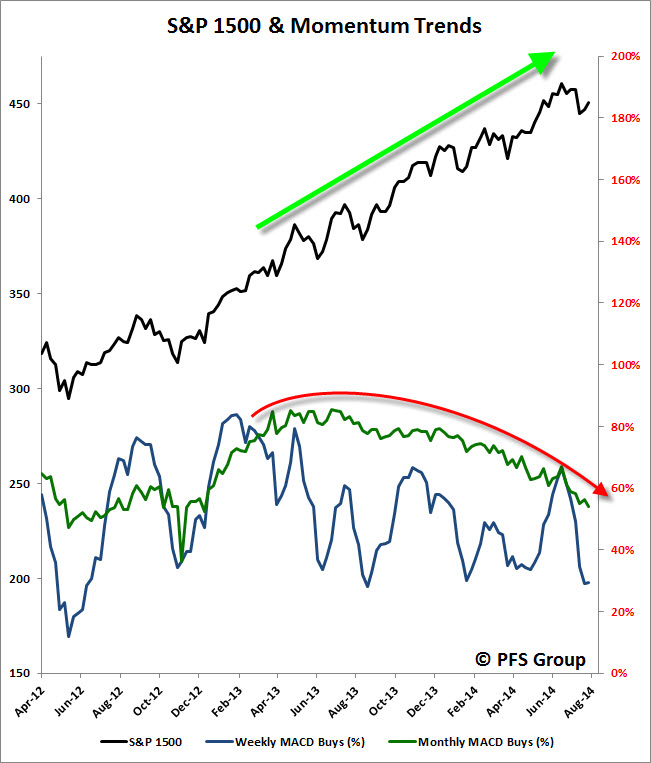
Source: Bloomberg
There are two catalysts I see that could spark a deeper correction after the present relief rally runs its course. The first being the most obvious, which is further escalation on the Ukraine/Russian front that eroded even further today as the following Bloomberg story illustrates:
Ukraine Says It Destroyed Part of Armed Convoy From RussiaTensions flared in Ukraine yesterday as the government said its army destroyed part of a column of military vehicles that crossed the border from Russia, even as Vladimir Putin denies any military presence in the country…
The incident adds to the tension building over Russia’s plan to send about 275 trucks with what it says is humanitarian aid to rebel-held areas in eastern Ukraine. Even with Ukraine saying it doesn’t see the armed vehicles as the sign of potential invasion, their arrival raised the stakes, said Volodymyr Fesenko, of the Penta research institute in Kiev.
The second catalyst is likely less visible or talked about, which could be a slowdown in US economic growth stemming from prior inflationary pressures. Back in June I laid out the case that we could see a peak in the markets by the fall which would be predicated on a slowdown in US economic growth (click for article). In the article I illustrated the tendency for inflationary trends to act as leading economic indicators and, given the trough in inflation in early 2014, we could see the negative impact of rising inflationary trends hit in the fall. While I won’t present an update of all the charts in that article, one I do want to highlight is an updated version of the price index from the National Federation of Independent Business (NFIB), which tends to lead the ISM Manufacturing PMI by six months when inverted (rising inflation hurts economic activity). The NFIB Higher Prices Index suggests that the ISM PMI which is currently sitting near the upper end of its range since the economic expansion began should decline from now and through the rest of the year.

Source: Bloomberg
To be clear, while I do expect a growth slowdown in the coming months from stronger inflationary trends (not to mention weaker exports to Europe which has been showing eroding economic growth) I am in no way calling for a recession or bear market. My recession probability model suggests only a 3% chance of a recession on the near horizon and I typically wait to see a 20% reading before getting worried.

Source: Bloomberg
Additionally, the Philly Fed’s State Leading Indicator recently posted a 1.86% growth rate, which is near the upper range of the last decade and well above recessionary warning levels (the orange 0.50% line) or outright recession levels (red 0% line).
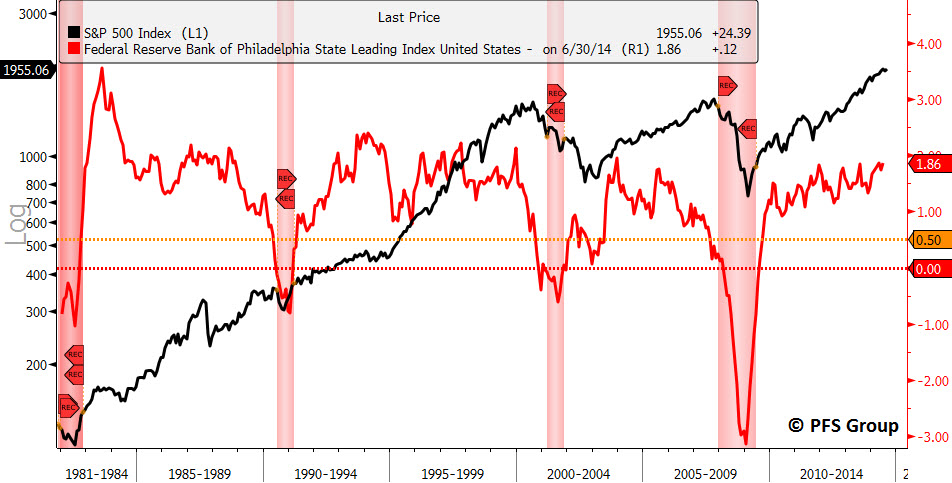
Source: Bloomberg
Consequently, I think we may be in store for some rough seas ahead but nothing too drastic to sink the bull market and economy. Rather, now is the time to focus more on the return OF your capital than the return ON your capital.


