


The markets were able to eke out a further week of gains with small cap stocks leading the charge as the Russell 2000 rallied 1.47% for the week while mega cap stocks like the S&P 100 lagged, falling 0.13%. Energy was the top performing sector (+1.78%) while the telecommunications (-0.89%) and financial sector (-0.53%) were the worst performing sectors. The NASDAQ hit a 52-week high during the week with the S&P 500 knocking on the door of an all-time high. Looking deeper, we see that the financial and consumer discretionary sectors have held the market back since the recent February bottom, with consumer staples also acting as a drag. Given the financial and consumer discretionary sectors are 30% of the entire S&P 1500, the market will have a hard time making much progress until we get some positive momentum in those two key sectors. Intermediate-term indicators are heavily overbought and suggest the market softens next week.
Follow the Money – Weekly ETF Flows
When looking at inflows and outflows into major exchange traded funds (ETFs), we can see a clear preference for technology exposure as more than $1B flowed into the Powershares QQQ Trust (QQQ), while energy also saw some strong inflows as $739M flowed into the Energy Select Sector SPDR (XLE). On the other side of the ledger, we saw large outflows from small cap ETFs amounting close to $1B when looking at the iShares Russell 2000 (IWM, $674M outflows) and the iShares Core S&P Small-Cap ETF (IJR, $215M in outflows). A key chart to point out would be the strong inflows into junior mining stocks as $161M flowed into the Market Vectors Junior Gold Mining ETF (GDXJ). As seen by the second chart below, there has been a large and steady inflow of money into GDXJ since the beginning of 2014.

Source: Bloomberg

Source: Bloomberg
S&P 1500 Member Trend Strength
For gauging the market’s trend we look at the S&P 1500, which encompasses the S&P 500 Large Cap stocks, the S&P 400 Midcap stocks, and the S&P 600 Small Cap stocks, and comprises more than 90% of the entire US market cap.
As shown below, the long-term outlook for the S&P 1500 is clearly bullish as 74.0% of the 1500 stocks in the index have bullish long-term trends. The market's intermediate-term outlook moved up another notch as it moved into neutral-bullish territory by moving to 56.2% this week from last week’s 49.2% reading. The market’s short-term trend also was upgraded this week as it moved into neutral-bearish territory at a 40.2% reading, up from last week’s 36.6%.
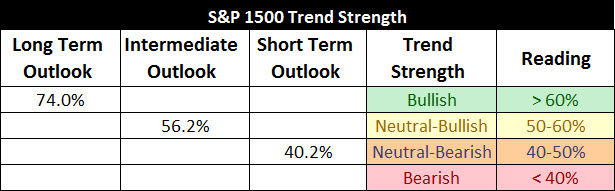
* Note: Numbers reflect the percentage of members with rising moving averages: 200-day moving average (or 200d MA) is used for long-term outlook, 50d MA is used for intermediate outlook, and 20d MA is used for short-term outlook.
The most important section of the table below is the 200d SMA column, which sheds light on the market’s long-term health. As seen in the far right columns, you have 74.0% of stocks in the S&P 1500 with rising 200d SMAs and 73.0% of stocks above their 200d SMA. Also, eight out of ten sectors are in long-term bullish territory with more than 60% of their members having rising 200d SMAs, with the utility and telecom sectors the only ones with a reading below 60% at 43% and 53% respectively.
One area of concern is the fact that financials and consumer discretionary stocks have had weak recoveries since the February lows as more than half of their members are still below their 50d moving averages (see red box below). The concern with weakness in these key sectors lies in the fact they represent 30% of the S&P 1500 and are acting as a brake to the market’s current rally. To sustain a breakout to new highs these key sectors need to participate and improve.
While financials and consumer discretionary sectors are weak, they are still not market laggards. When looking at the leaders and the laggards we see downside leadership in traditionally defensive sectors, which is not a cause for alarm. Of note, within the top four are cyclical sectors like industrials (88%), technology (84%), and materials (82%), which also support a lack of evidence for a market top.

Source: Bloomberg
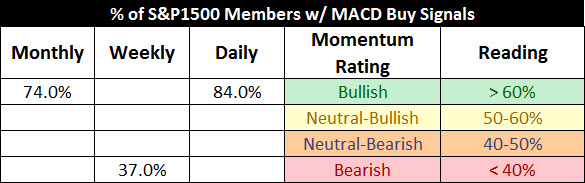
S&P 500 Market Momentum
The Moving Average Convergence/Divergence (MACD) technical indicator is used to gauge the S&P 1500’s momentum on a daily, weekly, and monthly basis. The daily MACD flipped back to a buy last week for the S&P 1500 while weekly MACD remains on a sell signal. Most importantly, the monthly buy signal given in 2012 remains in force as the market’s long-term momentum remains solid.

Source: Bloomberg
Digging into the details for the 1500 stocks within the S&P 1500 we can see that the daily momentum for the market has improved markedly from a reading of 17% two weeks ago to 84% this week. As stated in the past, readings below 20% are associated with short-term bottoms and why the rally off the February lows was not surprising.
The intermediate momentum of the market also improved by inching up to 37% from last week’s 34% reading. Currently, the weekly numbers are at levels we’ve seen with intermediate-term bottoms in the past.
The market’s long-term momentum remains solid at a strong 74% this week, putting it well into bullish territory as the market’s long-term momentum remains steady. The best way to read the table below is that we are still intermediate-term oversold in a bullish market with an improved short-term picture from last week.
Source: Bloomberg
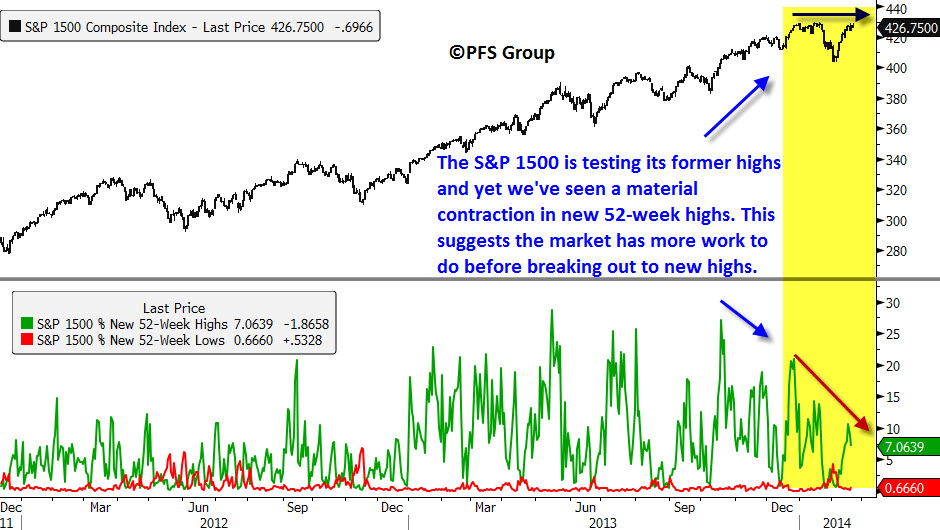
52-Week Highs and Lows Data
What continues to be encouraging about the market is that new 52-week highs continue to dominate new 52-week lows. Looking at the various market cap segments shows the greatest strength in the S&P 500 large cap index with small caps (S&P 600) showing the weakest performance.

Source: Bloomberg
The weakest links for the market remain financials and consumer discretionary as they make up the bottom of the pack in new 52-week highs while consumer staples continue to act as a market laggard. Health care continues to remain a market leader with utilities moving up the ranks to join the technology sector.

Source: Bloomberg
One area of concern is the lack of expansion in new 52-week highs as the market approaches a former high. This suggests the market’s internal strength is not strong enough to push through resistance on this first try and that we likely have more backing and filling in the weeks ahead before new highs are seen.
Source: Bloomberg
Market Indicator Summary
Below is a multi-indicator chart of breadth and momentum in the S&P 500, which shows we reached an oversold condition in early February and have snap backed to an opposite extreme. Given three of my four intermediate-term indicators are very overbought, I would expect sideways to downward movement in the markets next week.

Source: Bloomberg
Summary
The most important take away from this report is that the long-term trend and momentum of the market remain deep in bullish territory. The markets have rallied off the February lows but are struggling to hit new highs as the financial and consumer discretionary sectors have failed to rally materially off their lows. Two areas of concern are the lack of expansion in new 52-week highs as the market nears its former highs as well as the fact intermediate-term indicators are at extreme overbought readings and suggests we should see some softness next week. My guess is we have some choppy market action ahead before seeing new highs.


