


Since 2012 we’ve seen the balance sheet of the European Central Bank (ECB) contract as Europe has been slowly healing after the upheaval in 2011. While the Euro has rallied and European equities have enjoyed strong gains, conditions in Europe remain difficult. As seen below, the average unemployment rate for the PIGS (Portugal, Italy, Greece, and Spain) remains north of 20% as they are in a deep depression. Meanwhile, Germany’s 6.8% unemployment rate is the lowest seen by the country in decades.

Source: Bloomberg
Given the dichotomy above it’s natural that Germany would want to see strong monetary policy while most of Europe would prefer a dovish policy. While Germany may be able to fend off the European doves when European growth is steady, it is unlikely Germany can hold its ground should economic growth begin to slip.
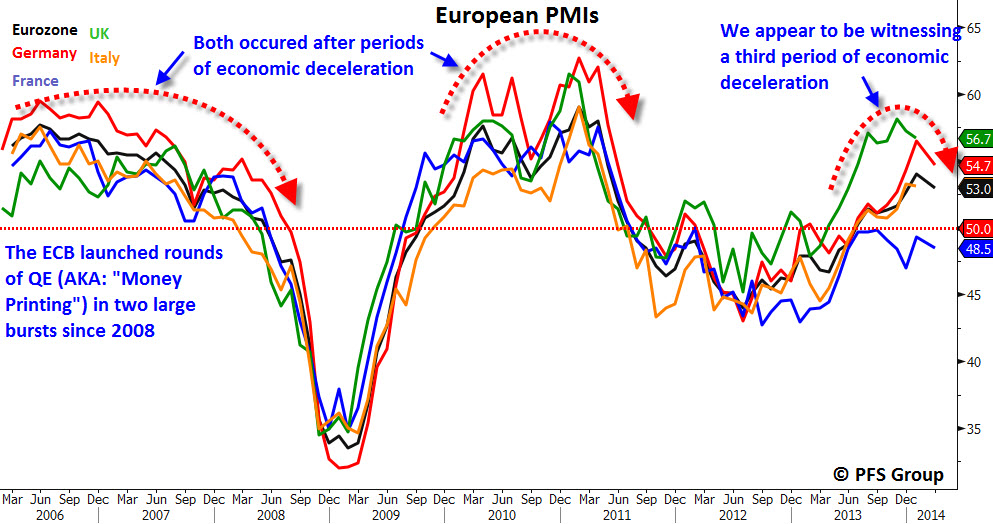
We’ve seen two periods since the 2008 global financial crisis in which the ECB printed in large scale and both came after economic growth had peaked. This can be seen below when looking at various European Purchasing Manager’s Indexes (PMIs), which show the economic contraction in 2008 and 2011. Currently we are seeing the likelihood of a third peak in economic growth, though the PMIs (except for France) remain in positive (>50) territory.
Source: Bloomberg
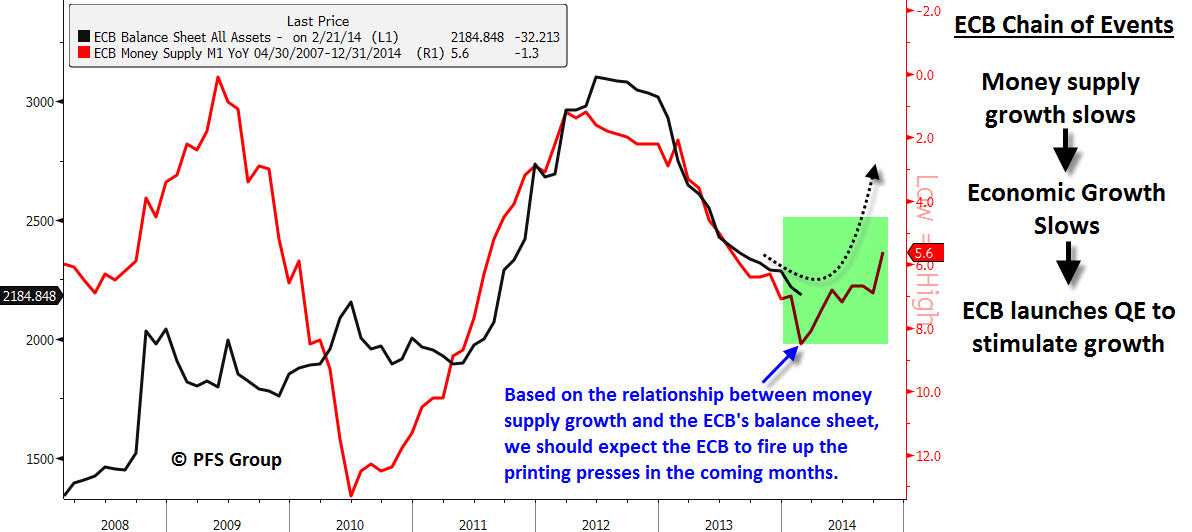
While some may argue that one month of falling PMIs in Europe does not make a trend, one leading economic indicator for PMIs suggests more weakness in Europe lies ahead. One of the best tools for forecasting economic growth and stock market returns is money supply growth rates (one of the 10 indicators in the Conference Board’s Leading Economic Index). Money supply growth tends to lead economic growth by several months and the recent decline in European M1 money supply growth suggests the European PMI should continue to decline well into 2014 with the recent reading likely marking a top and slipping into contractionary territory (<50) by this summer.

Source: Bloomberg
Given that European money supply leads economic growth rates and that the ECB tends to respond to economic growth with a lag, it makes sense that the ECB’s balance sheet follows the Eurozone M1 money supply growth with a lag. This relationship can be seen below in which the M1 money supply is shown in red and inverted for directional similarity with the ECB’s balance sheet, and suggests we are likely to see the ECB bring out the bazookas in the coming weeks to months to combat faltering growth.
Source: Bloomberg
Unlike in 2011 when the ECB expanded its balance sheet by more than a trillion euros, there is far more cover for the ECB to print aggressively now compared to then. As shown in the first figure above, unemployment rates have risen dramatically since 2011 in nearly every country except for Germany and provide far more cover to print now than a few years ago. Additionally, the current inflation picture is far more supportive of monetary easing than it was in 2011 when many CPI inflation rates in Europe were near 5-year highs. Currently you have most of Europe on the verge of seeing outright deflation with the Eurozone CPI annual inflation rate coming in at a meager 0.80%.

Source: Bloomberg
So, we have the likelihood of European economic growth contracting over the next several months and a much more dovish backdrop for the ECB to print relative to 2011, all of which suggests we should see the ECB bring out its big guns sometime in early 2014. If the ECB does in fact expand its balance sheet aggressively, what will the likely fallout be?
A review of what transpired after the ECB printed in 2011 sheds some light to this question. As you can see in the chart below, on the heels of a market correction the ECB began to signficantly print (top panel), with global stock markets then putting in a significant bottom and rallying sharply thereafter (middle panel). Additionally, we saw the USD Index put in a bottom while commodities slipped into a multi-year bear market (bottom panel).

Source: Bloomberg
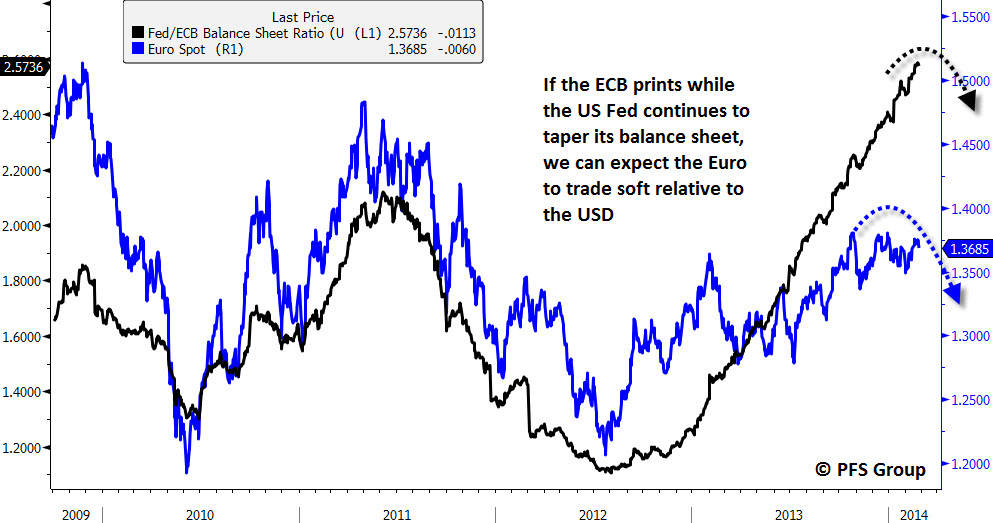
Should the ECB expand its balance sheet at the same time the US Fed is slowing its pace of purchases, we are likely to see the Euro weaken relative to the Dollar as seen below. Thus, should the USD rally in the face of an aggressive ECB, then anti-USD investments are likely to get hurt while investments that are correlated to the USD should benefit. Given a stronger USD will likely lead to lower commodity prices, consumer discretionary spending will improve and the Consumer Discretionary Sector SPRD (XLY) may benefit the most by an aggressive ECB while commodity-based sectors like Energy (XLE) and Materials (XLB) may suffer.
Source: Bloomberg
Shown below is the performance of the various S&P 500 sectors one year out from August 17th 2011 when the USD began to rally relative to the Euro. As seen below, the consumer discretionary sector (XLY) outperformed the S&P 500 by 6% while the energy (XLE) and materials sector (XLB) underperformed the market by more than 10%.

Source: Bloomberg
Summary
One of the most reliable leading economic indicators is the growth rate of the money supply (M1). By looking at M1 in Europe, European growth should begin to disappoint in the weeks and months ahead. Given persistently high unemployment rates and the threat of deflation, the stage may be set for ECB President Mario Draghi to bring out the monetary bazookas. If that were to occur at the same time the US Fed slows its purchases, the USD should see a strong rally relative to the Euro. Based on what occurred in 2011 when the ECB last launched a strong round of QE, global stock markets should rally while commodities suffer under a strong USD, and commodity-sensitive sectors like energy (XLE) and materials (XLB) would suffer while consumer stocks (XLY) rally.


