


While higher stock prices are often cited as the biggest beneficiary of the Fed’s several rounds of quantitative easing (QE), a lesser cited beneficiary has been overall market volatility and the credit markets. With each round of QE and/or “Operation Twist” we’ve seen measures of financial stress in the credit markets (like the Ted Spread or BBB corporate bond yields to 10yr UST yield spreads) contract as seen below. Similarly, whenever we’ve seen the cessation of QE we are treated to a spike in financial market stress and with the ending of the Fed’s recent QE program in October of 2014 we are already seeing the first signs of stress in the corporate bond market as BBB spreads to 10yr UST yields rise. In fact, they have risen so much that they have retraced all of the improvement seen since QE3 began.

Source: Bloomberg
There are likely two big reasons the Fed ended QE and why it is considering raising interest rates for the first time since 2006. The first is a strengthening jobs market that is gaining momentum as last year the U.S. averaged 241K job gains a month, the strongest yearly average growth since 1999 and the fifth strongest in the last quarter century. Perhaps even more surprising is that the U.S. economy has seen 50 months of consecutive payroll gains, the longest streak seen in the history of the data that goes back to 1939.
We all know this has not been a typical recovery since the Fed has kept the U.S. economy on a QE monetary IV drip but it does appear the U.S. economy is finally making some traction. The economic expansion is now 66 months old and nearly two years longer than the average expansion. At this age of an expansion the economy should be slowing down and it's doing just the opposite as payroll growth is accelerating as is overall GDP growth. Part of the reason the U.S. economy has been accelerating this far into the cycle is that the monetary transmission mechanism has been finally unclogged as banks are beginning to lend. For the bulk of this entire 6-year recovery bank lending growth has been below GDP growth, which typically is only seen during or just after a recession. Part of this stems from stricter regulation for banks to have higher capital ratios and stricter lending standards, but the freeze in bank lending appears to be thawing. In fact, currently total commercial bank loans outstanding is growing at a 7% year-over-year (YOY) growth rate, which not only is the strongest rate since 2008 but also finally above the economy’s growth rate. This means that money velocity may finally turn up.

Source: Bloomberg
Given the removal of QE from the financial markets and the prospect of a Fed rate hike later in the year (current consensus believes first hike occurs this June), rather than a source of stability, as in recent years, the Fed is likely to be a source of instability this year, particularly when comparing its stance relative to other central banks. While the Fed has now joined the Bank of England (BOE) on the potential rate-hiking bench, the Bank of Japan (BOJ) is still aggressively playing the QE ball game while it is widely expected the European Central Bank (ECB) will join the BOJ on the playing field this year. Given the Fed and the BOE were far more aggressive in expanding their balance sheets since 2008, there appears to be some room for the BOJ and ECB to play catch up when comparing balance sheet growth.
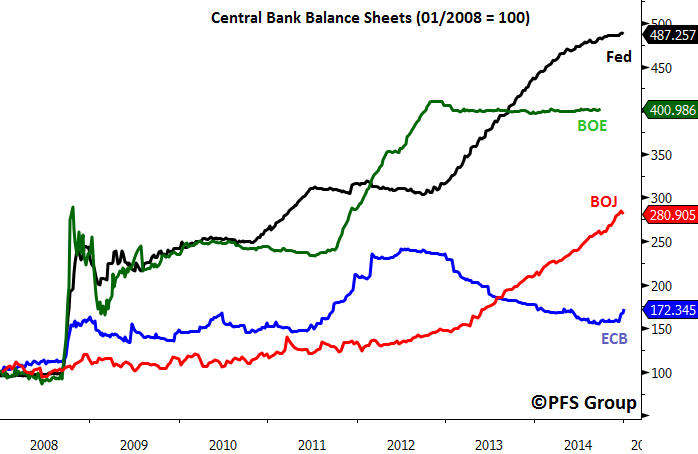
Source: Bloomberg
The diverging central bank policies in which the Fed moves towards a tightening mode while the ECB and BOJ move towards an easing mode is likely to put upward pressure on the US Dollar, which has experienced a strong move recently. In fact, the USD Index just broke out of a bearish trend that goes all the way back to late 2005 and looks eerily similar to the breakout that occurred in early 1997. The current USD Index breakout is shown below in the top panel with the 1997 breakout shown in the bottom panel and advanced to the present time.

Source: Bloomberg
A strong dollar typically goes hand in hand with lower commodity prices, which is welcome news for the U.S. consumer and economy. With the recent surge in the USD, oil prices have collapsed by over 50% in the last six months, pushing the national average gasoline price down to nearly a gallon, the lowest price in six years. While a strong USD benefits the consumer, it hurts foreign debtors holding USD-debt as mentioned above. In 1998 there was roughly trillion in outstanding USD debt to non-banks outside the U.S., but that has since accelerated since 2006 to over trillion in outstanding debt, much of it in poorly managed emerging market economies.
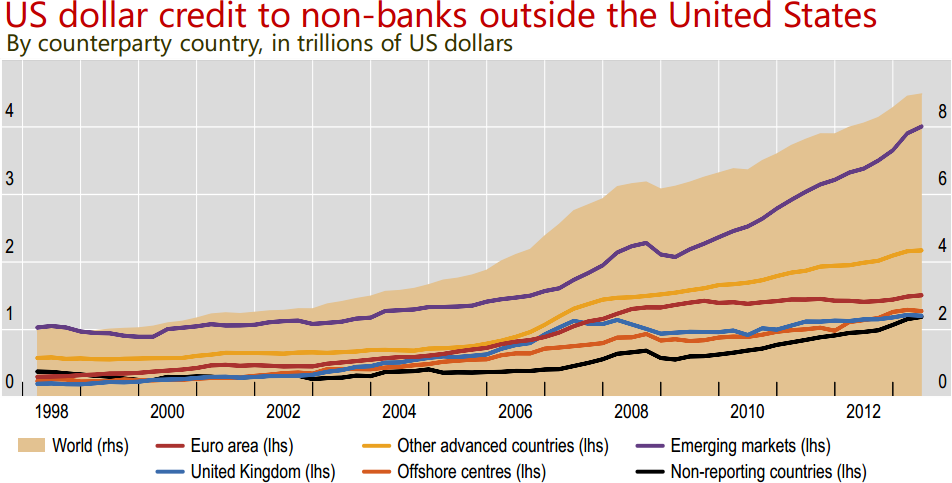
Source: Bank for International Settlements, “Financial Stability Risks: Old and New”
Given the divergent global economic growth rates and thus diverging central bank policies, I expect the dollar to continue to appreciate compared to its global peers, which should create some financial instability globally as dollar-denominated debt loads increase in value along with an appreciating dollar, similar to a replay of the late 1990s.
The US Dollar Index bottomed in 1995 and began a six year bull market before peaking in 2001. Concurrent with the bottom in 1995 was a bottom in the Volatility Index (VIX), which also began an upward march in the latter part of the 1990s. As mentioned earlier, the USD Index rally gathered steam in early 1997 when it broke out of a prolonged bearish trend and jumped sharply higher. Soon after we saw the onset of the 1997 Asian Financial Crisis and where the VIX hit a peak 51-weeks after the USD began to rally. The USD sold off heading into the end of 1997 but reasserted its bullish trend going into 1998 which helped precipitate the Russian Ruble Crisis of 1998 where the VIX peaked 44-weeks after the USD rally began. Given the USD Index rally began to gather steam in the middle of 2014, 44 weeks to 51 weeks marks April to June of 2015 as a potential window where we could hit a peak in volatility caused by the surging dollar.

Source: Bloomberg
Echoing the late 1990s we are seeing a replay of the Russian Ruble crisis in which the Ruble has plunged by more than 50% in the last year relative to the dollar and could very well be our first casualty. In addition to Russia, other potential victims are oil export nations like the Middle East and parts of Latin America.
The pickup in financial market volatility seen in 1997-1998 did not spell the end of the bull market nor the economy, but risks always pick up when volatility rises. Recession and bear market risk need to be monitored intently ahead. Currently there is little risk of slipping into a recession based on my recession probability model, showing only a 2% chance the U.S. economy is either in or slipping into a recession in the coming months.

Source: Bloomberg
You do not have to have a recession to experience a bear market as we had mini bear markets in 1998 and 2011, but to determine whether the bull market lives on or if we are slipping into a bear market I rely on two simple indicators, the monthly MACD on the S&P 500 and the slope of the 200-day moving average for the S&P 500. Since the middle 1990s we’ve experienced four significant monthly MACD sell signals on the S&P 500. They occurred in 1998, 2000, 2007, and 2011. Currently we remain on a buy signal but the markets will need to start advancing soon or we face the risk of our first monthly sell signal in four years.

Source: Bloomberg
The other helpful tool to discern bull and bear markets is the slope of the 200-day moving average (200d MA) for the S&P 500. Bull markets are associated with a rising 200d MA while declining for a bear market (see red regions below). We’ve only had one whipsaw in over a decade which was the short 2011 mini bear market.
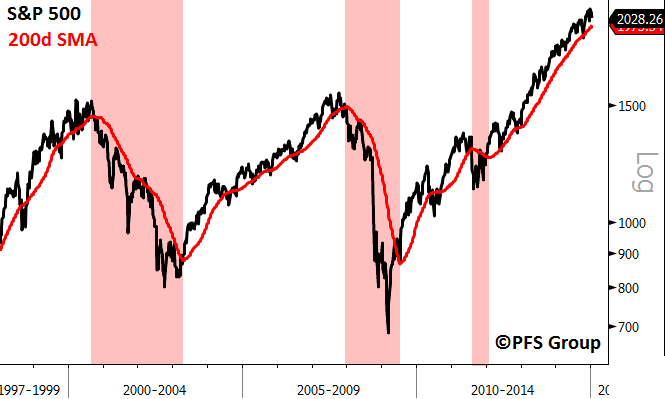
Source: Bloomberg
Hopefully monitoring the two tools above will help investors discern whether or not a pickup in volatility brought on by a less accommodative Fed and rising USD will push the stock market from bull to bear. Whether or not we have a bear market this year we are likely to experience a much bumpier ride than in 2013 or 2014. This is likely a year for investors to wear their seat belts and fasten their harnesses.


