


Executive Summary
Last week, the Federal Reserve continued to decelerate its rate hikes with a quarter point hike to a 4.5%-4.75% target funds rate. Chairman Powell’s tone and composure at the press conference were seen as relaxed – as if the goals of policy are within reach. The S&P 500 is up 7% year-to-date and the tech and growth-filled Nasdaq Composite Index is up 13.72% year-to-date. Investors have been celebrating that the worst is behind us and the prospects of a soft landing in the economy is the base-case scenario.
Inflection Point Q1
The majority of 2023 predictions I read from Alpine Macro, Goldman Sachs, Piper Sandler, and Bank Credit Analyst (BCA) suggested there would be pain in the first half of the year and then gain in the second half. My oh my, outlooks have changed in only a month. Now, the very same houses are calling for gains in the first half and pain in the second. This is to show that it isn’t easy to predict market cycles. The key to being a good investor is the ability to adapt and recognize change when it is apparent, and the courage to act early to the change. This is when most investors get the trend wrong – at tops and bottoms – because it’s not easy to recognize an inflection point, especially under the influence of greed or fear.
An inflection point is here now as investors have rotated out of the areas that served well to protect in 2022 and into the areas that suffered. Long-term rates have fallen in anticipation that the Federal Reserve is getting close to a pause in rate increases. As such, interest-rate sensitive areas have seen gains in bonds and housing in addition to high-beta names in momentum and technology. Until the fundamental outlook changes, I believe the recent rotation into interest-rate sensitive and high-beta companies is a trade and not the beginning of a new bull market. There will be a limit to how high the market can rise while earnings continue to decline and this will be the ceiling stock prices run into in Q1 and early Q2, even as the Fed pivots to a pause – a move investors are discounting now. Because valuations look cheap in growth and high beta relative to late-2021, there will be room for growth to rally as the rotation continues out of defensive sectors and into offensive sectors. If fundamental indicators and earnings continue to decline, the soft landing could turn into a hard landing in the second half. For now, employment remains strong, and I don’t think a hard landing is likely until that changes.
Expectations
Conservative and balanced investors will likely see underperformance in the first half of the year as shifts into high-beta names – for the limited exposure to stocks (20% and 40% respectively) these two objectives have – are not suitable investments for conservative investors. Growth with income and Growth investors with greater exposure to stocks will perform in the first half while trends are bullish, and the rotations move out of defense and into high-beta growth companies. If the economy continues to worsen, then we could see the very names performing now reverse and end badly. Despite the perceived Fed pivot, the Fed continues to withdraw liquidity at the tune of $95B a month. Even if the Fed pauses rate hikes in one or two months, the fed funds rate is now higher than the PCE Index. The effect of such moves tends to reduce asset prices and increase the chances of a hard landing as long as the Fed implements a restrictive policy.
It will be a year to be nimble. There are opportunities now for growth while it is here, but valuations will become stretched if earnings do not recover and economic conditions continue to deteriorate to bring about a hard landing. It will be a time to row with active management versus a time to sail the market trends as change will be the one constant in 2023. (End Executive Summary)
Market Catalysts
One of the driving responsibilities I have of updating Financial Sense Newshour subscribers is performing the market wrap-up report every week. I find this to be one of my most important responsibilities as an advisor. Keeping attuned to the catalysts that move the market makes it easier for me to understand why the market is trending or rotating on a weekly basis. It has helped me to identify the major shifts when they happen. While technical analysis shows what is happening, listening for the catalyst explains the why. A market catalyst is a news item that shifts the perception of investors or supports the current theme. It can be an economic announcement, a change in monetary policy, an unforeseen event, act of God in weather, and changes in government policy that shift the mentality of investors. I’ll be reviewing the current themes and market catalysts that investors are focused on right now and when they change how it can affect market prices.
Inflation
Inflation has been a driving theme for investors for two years. It’s what has influenced monetary policy to fight it and, as such, created change in interest rates, credit availability, and mortgages rates. The recent policy shift to raise rates by 4.5% in less than a year has been the most aggressive rate hike shift in my 28 years in the business. With that change, mortgage rates have doubled making already unaffordable living due to a steep rise in housing prices more unaffordable with higher mortgage rates.
At first, inflation was caused three years ago by the Covid Pandemic and the supply-shock that was caused by shutting down manufacturing and businesses. Then we had money supply inflation as the Federal Reserve lowered rates and flooded the economy with liquidity by buying bonds – for too long – influencing housing prices and the stock market. We have witnessed a second supply-shock because of the Russia-Ukraine War on food and other commodities.
As economies have re-opened post-pandemic, we have begun to see disinflation in goods. The US has tapped into its Strategic Petroleum Reserve (SPR) helping to reduce energy inflation. The Federal Reserve has tightened monetary policy thereby reducing the wealth effect in the financial markets and housing. These steps have all been catalysts resulting in the disinflation we see now.
Headline Consumer Price Index

There are still areas where prices are increasing mainly in shelter and services while recently there has been a peak in the rate of change for food and electricity prices. The Federal Reserve is continuing to monitor these areas, especially services which tend to be sticky. If these areas eclipse the goods disinflation we’ve seen, the CPI could rise again.
“As I started to mention earlier, we have a sector that represents 56% of the core inflation index where we don't see disinflation yet. We don't see it, it is not happening yet.” Fed Chairman Powell 2/1
Monetary Policy
The Federal Reserve will likely maintain elevated rates through 2023 as the victory over inflation is far from achieved in the Fed’s eyes. Next month, March, the Federal Open Market Committee will update its economic and policy expectations for the year – what we call the Dot Plot. December projections suggested we get one or two more 25 basis point hikes, and we just had the first. My guess, based on the Fed commentary this week, is we still may get two more hikes, but investors in bonds and stocks have already discounted the Fed’s plans to pause soon. The biggest concern going into this week’s meeting was whether Powell would speak against the recent rise in stocks and bonds as contradictory to the Fed’s restrictive policy communication, but he did not. Instead, he spoke very encouraging words:
“I still think and continue to think there is a path to getting inflation back down to 2% without a really significant economic decline, or significant increase in unemployment.” – Fed Chairman Powell 2/1.
Interest Rates
Investors have been steadily discounting a Fed pivot since October of ’22 when it was communicated the Fed would need to consider the lagged effects of raising rates as aggressively as they did. Since then, the long end of the yield curve has come down considerably. Another catalyst affecting rates at that time was the UK’s consideration of tax cuts during high inflation that resulted in the resignation of the prime minister. Additionally, there was a WSJ article the week of October 16th by Nick Timiraos suggesting the November hike of 75 basis points would be the last such hike and smaller increases could begin in December. Fed President Daly and Fed President Bullard made similar comments that week. Before these events, investors were predicting a high chance for another 75-point hike in December. After the WSJ article and after the Fed-speak, we saw those predictions drop; and therefore, long-term rates came down for the US.
10-Year Treasury Yield

As you can see from my chart above, we are at a critical point for long-term rates. There is a convergence of three supportive levels. Usually, a convergence of such support is strong; however, the longer yields remain here and do not inflect higher, the higher the chance such support can break. I believe this will be a key trend to watch in February as housing and growth stocks have lifted nicely because of rates coming down. An inflection higher here could be a catalyst against such gains if it is a result of inflationary pressure. If instead, rates rise on good economic conditions, it is seen as a sign of recovery. At the same time, a significant decline because of bad economic conditions would also be a deflationary omen for stock prices and fear over earnings prospects would see stock prices move lower. It will not only be important to understand which direction rates go, but also why they are moving in the direction they are.
Tech Cutting Costs
For many years, the technology and communications industry was engaged in a highly competitive race to attract top talent from around the globe. This reached a peak in 2021 and there were numerous signs the tech sector became bloated as an abundance of profits and rising stock options funded the excesses of this industry. Ballooning staffs and top of the list desire for college graduates to work in Silicon Valley or at mega tech companies became an identity. Expensive corporate campus lifestyles and the carrot of generous stock options created a bubble in the labor industry and with stock prices down more than 50% at these companies in the past year, the bubble has now burst. The cover of such a story was last year’s layoffs at Twitter after Elon Musk took over, firing half of the workforce.
A recent Bloomberg article this week suggests that big tech is still bloated by 20% even after recent layoffs, according to Bank of America strategists. The article claims more than 100,000 layoffs have been announced since 2022.
“Sales have historically been the main driver of margins…Weakening demand and negative operating leverage suggest to us more margin pressure ahead.” – Savita Subramanian, BofA
Wall Street has been in a mad dash to pick up tech and momentum stocks in recent weeks as the cost cutting is being seen as a turning point towards better profitability. Meta Platforms recently announced further cuts at this quarterly meeting having reported a lowered expense guidance of $89-$95 billion after forecasting this year’s expenses at $96-$101 billion in Q3. Additionally, the company announced a $40B stock purchase program. Wall Street liked what it heard, helping the stock to finish up 23% Thursday of last week. NVIDIA announced $3B in cost cuts last quarter. The stock is up 80% off its lows in October. CEO Tim Cook last week announced Apple will be cutting costs and hiring as the company missed on earnings and revenue estimates. Alphabet (GOOG) has been slow to cut expenses having increased expenses 18% in Q3 and increased jobs 13,000. It wasn’t until January 20th that they announced a reduction of 12,000 jobs. As such, the company posted its third consecutive earnings per share (EPS) miss, something it hasn’t done in five years. Wall Street has been rewarding the cost cutting efforts of companies during the Q4 earnings seasons and has been one of the major catalysts propelling tech and growth stocks higher. The issue, however, is that cutting costs only helps profitability and doesn’t help growth.
As companies continue to announce earnings this season, the blended estimates for earnings growth continue to decline throughout the season to negative 5% as of last Thursday. According to FactSet, companies with more exposure to international revenue are reporting weaker earnings and revenue. The information technology and communications services sectors are the top two contributors to the largest earnings and revenue decline for S&P 500 companies with more international revenue exposure.
Improving Technical Outlook
The technical outlook for the market has improved on the surface during the onset of 2023. The rally in stocks and bonds that started in October continues. The indexes are rising, the dollar has been declining, sentiment and participation in the rally has improved, and sector rotations are pointing towards recovery as pro-growth stocks outperform.
Indexes
The rotation towards growth has been seen at the index level with an underperformance of blue-chip mature companies that populate the Dow Industrial Average versus the technology and momentum-laden Nasdaq Composite.
Dow Jones Industrial Average

This is taking place as tax-loss harvesting during the end of 2022 is over. Additionally, borrowers of shares that sold last year are having to buy back shares they borrowed as stocks rise (short squeeze). Some of the most heavily shorted stocks are listed on the Nasdaq compared to mature and well capitalized companies in the Dow Jones Industrial Average. Carvana (CVNA) was the second most shorted stock at 65% of float according to NYSE. Carvana’s stock is up 182% year-to-date while last quarter the stock announced a $2.67 loss per share and had to restructure $4B in debt.
Failure to hit new lows on the weakness in December was the setup for a trend reversal. A recent development last week in the indexes has been prices rising above the December peak. This is a classic confirmation of a trend reversal that began in October. Additionally, the S&P 500 is now trading above its key moving averages with the intermediate 50-day moving average crossing above the long-term 200-day moving average in what is known as a Golden Cross, a bullish signal.
S&P 500 Index

Dollar Strength
Two factors have supported a strong dollar over the past couple of years: 1) A stronger US economy relative to those economies that used more restrictive policies to curtail the Covid pandemic and 2) the Federal Reserve was faster to respond to inflation than other developed nations causing an interest rate differential in favor of investing in US debt that earns high rates of interest versus foreign debt.
Weakness
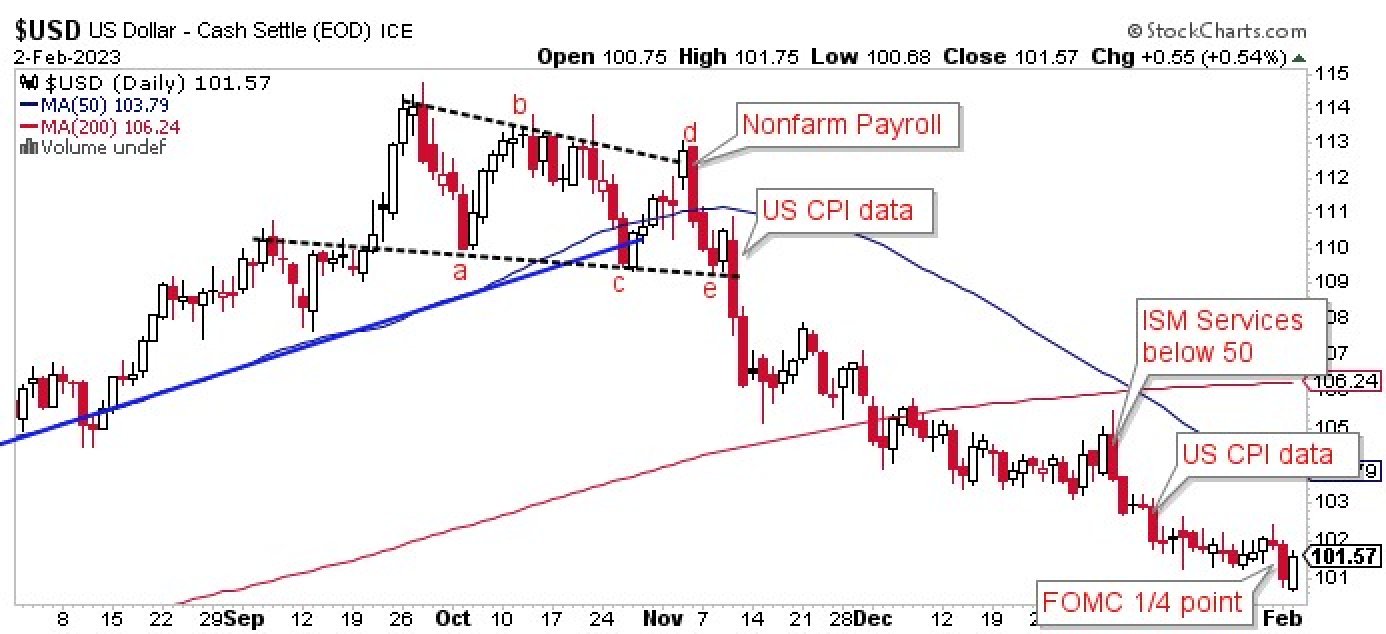
Evidence that inflation is cooling (and thus the Fed can relax its fighting stance), that the US economy is weakening, or that foreign economies are expected to recover or perform better are factors that are causing the dollar to fall in the past few months. The fire that ignited the weakness was the nonfarm payrolls report on November 4th which showed the worst daily percentage loss in the dollar since November 2015. The report was initially thought positive with 261,000 new jobs in October, but the higher unemployment rate and lower wage growth signaled to investors that surely the Fed could begin slowing its rate pace. And that communication continues through the past two rate hikes from the Fed from 50 basis points in December to 25 basis points in February with possibly one or two more 25 basis point hikes before the Fed pauses. The chart below shows key economic events that have caused the dollar to weaken.
U.S. Dollar
What it Means
The weakness in the dollar should help large corporations that derive significant portions of their business from foreign sales seen in technology and the communications sectors. Additionally, the weakness in the dollar has helped foreign investing and commodity investing. Since November 4th, gold has risen 15% to $1876, silver has risen 15.3% to $22.41, and copper has risen 18.4% to $4.06 per pound. The weakness in the dollar has made foreign investing a brighter possibility compared to the previous two years.
iShares MSCI ACWI Minus the US ETF Performance

Sentiment & Breadth
Sentiment & breadth indicators tell us how bearish or bullish investors are and help to pinpoint times when either group has gotten ahead of themselves in overbought and oversold markets. It can tell us how many stocks in an index are above short-term or long-term moving averages (breadth or participation measures) which tell if stocks are overbought or oversold. Some of these indicators tell us how much fear is being priced in the market by the ratio of put contracts to call contracts.
Sentiment
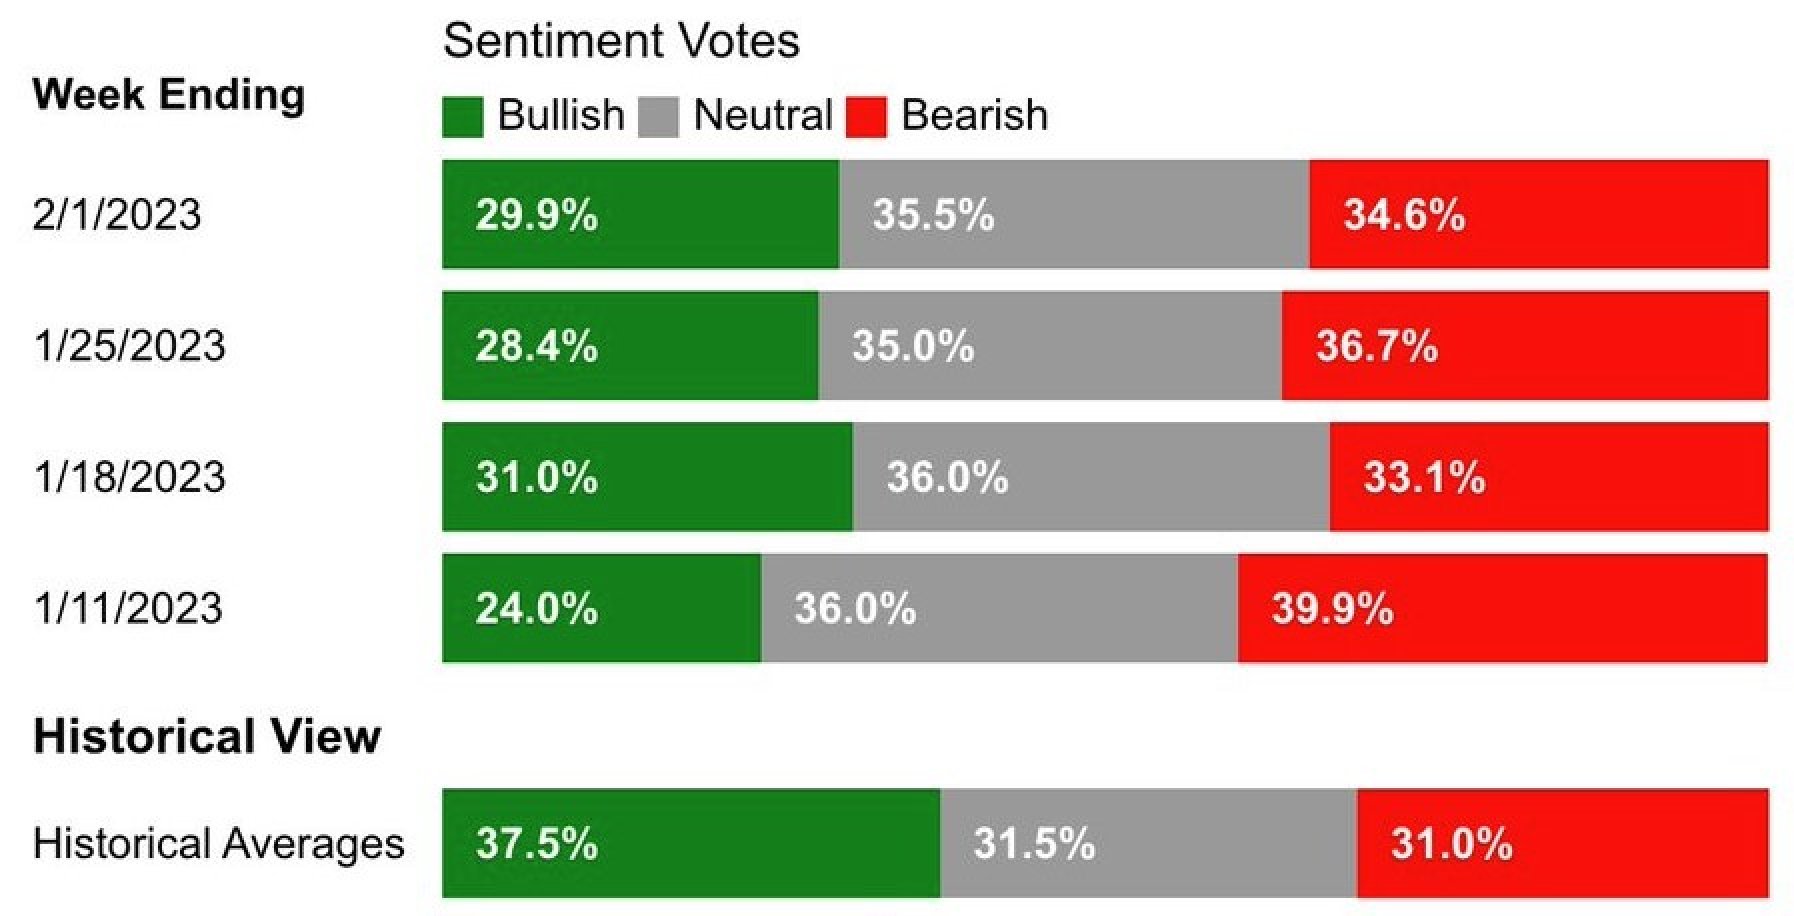
According to the AAII Sentiment Survey, bulls have steadily been rising while bearish sentiment has been falling. This is a pulse check on how investors feel about the market and the improving sentiment is an indicator that is confirming the bullish trend as of late but also shows there’s still more room to the upside.
AAII Investor Sentiment
Breadth
Breadth has been improving since October with 74% of the companies in the S&P 500 trading above the 50-day moving average – an intermediate trend indicator. A reading above 70% indicates an overbought market and is a useful tool when markets are in a sideway trend. It is best not to be buying stocks when the market is overbought as the probability of a successful purchase is lowered. When this indicator drops back below 70%, it’s usually a sell signal but in trending markets, stocks can stay overbought. A combination of a trend reversal in the indexes and a breadth sell signal usually supports that the trend has changed.
S&P 500 Percent of Stocks Above 50-Day Moving Average

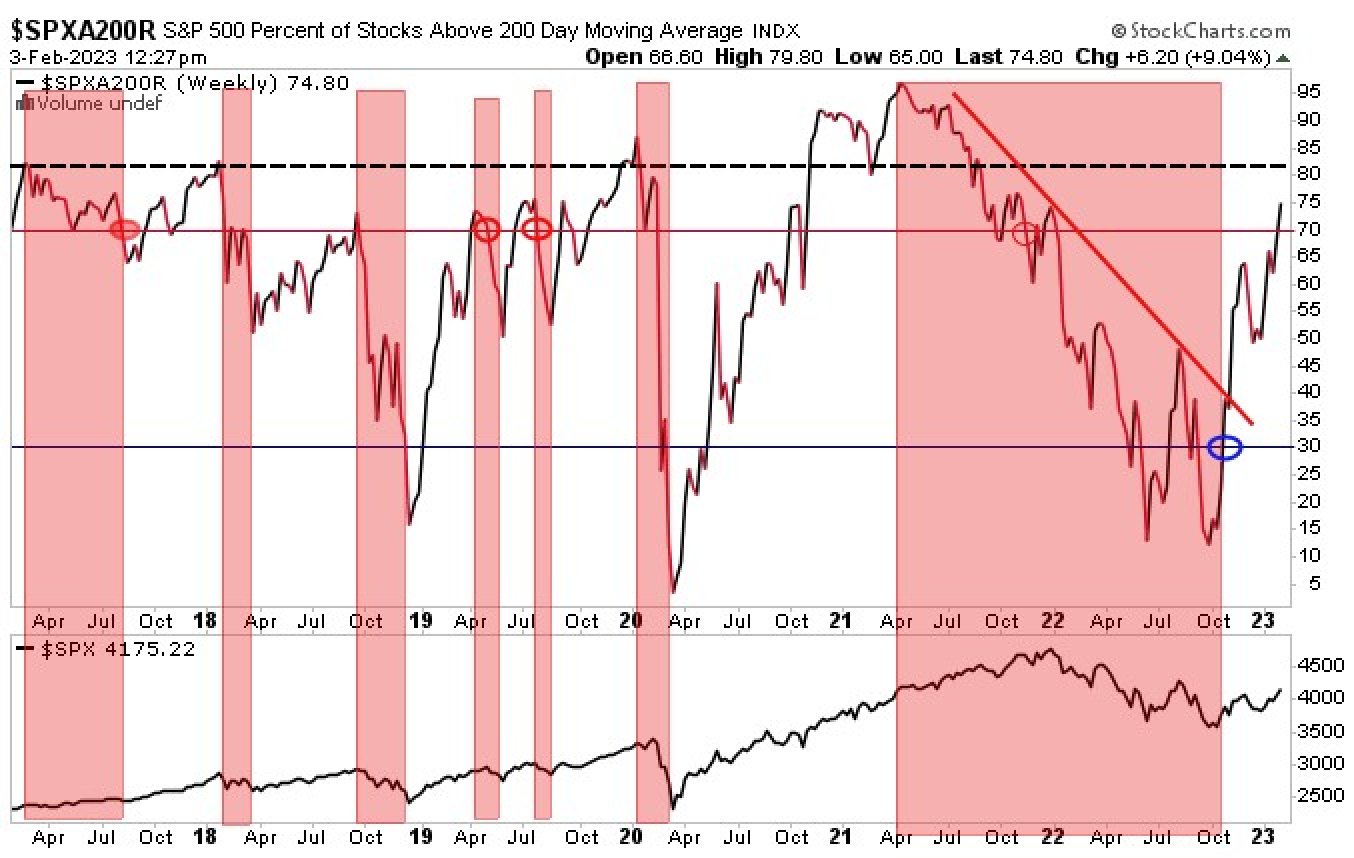
From a long-term perspective, stocks have also entered an overbought condition. 74% of the companies in the S&P 500 are trading above their respective 200-day moving average. This is a long-term moving average and it’s commonly seen as a bullish environment when stocks are trading above their long-term moving average. This is a less noisy indicator, but it can highlight a lack of participation in a rally or decline that can warn change is coming as it did in 2021, finally giving a sell signal in November when the indicator fell below 70%. If the soft landing is here and a recovery story in the economy surfaces, this indicator can stay overbought.
S&P 500 Percent of Stocks Above 200-Day Moving Average
Fear or Greed
The Volatility Index is known as the fear index. It is an indicator that represents the expectations for change in the S&P 500 because it is derived from SPX index options. As expectations rise for price swings, the volatility index rises. Historical data suggests there is a strong negative correlation to the volatility of the stock market and market prices. It can therefore be a strategic hedging strategy to employ the holding of the VIX ETF in times of market volatility. The below chart shows that the volatility index has been falling since October, supporting the rally. It shows no change in trend and so an imminent correction in the market is not foreseeable currently until an inflection in the downtrend of the VIX.
Volatility Index

Another indicator that has been very helpful at identifying bottoms has been the CBOE’s Equity Options Put to Call ratio. I like to use this indicator because the majority of investors that play in equity options are small speculators compared to the large trading professionals typically found in index options. So, the equity options put/call ratio can identify when speculators are too bullish (greed) or too bearish (fear). Speculators have recently purchased two calls for every put placing the ratio near .50 that historically places the current environment in the greed column. A sharp turn from calls and into more puts here would indicate a bearish shift in sentiment.
CBOE Volatility Index

Sector Rotation
Sector rotation, as developed by Sam Stovall, shows that the market turns up or down before the economic cycle. Certain sectors outperform relative to the others during market transitions from early recession, full recession, early recovery, and to full recovery. When one sector begins outperforming over another, it can often indicate perception changes over where the economy is heading. Last year’s outperformance of energy and staples is indicative of an economic cycle weakening. The transition to cyclical and technological companies as of late is indicative of early recovery.
Sector Rotation Model

The Relative Rotation Graph below is a new chart developed at StockCharts over the past few years that shows the relative change in sectors to the S&P 500 as a whole. When sectors are moving from lagging to improving, it suggests positive change. When sectors are moving from leading to weakening, it shows a rotation out of these sectors. The current trends show that real estate, communications, discretionary, and technology are improving while staples, financials, industrials, energy, and materials are beginning to underperform. These conditions are consistent with a market bottom as these are leading sectors anticipating an early recovery around the corner.
StockCharts RRG Chart

Summary
The technical outlook suggests a bull market is here. Cyclical stocks are rising, and risk appetites have improved. Often these are conditions seen when investors anticipate the Fed will pause its rate hikes. As investors anticipate a change in the fundamental outlook for the economy, it will be important to watch the fundamental indicators for confirmation of the recent change in technicals. And without monetary and fiscal stimulus, the current trend is likely a short-term one without the influence of these two powerful supports. However, if the housing market bottoms and Leading Economic Indicators (LEIs) and ISM Manufacturing and Services figures turn positive, it would confirm the bullish outlook investors have right now.
The Fundamental Outlook – Good or Bad Is Good?
The two key factors at the top of investors’ minds are inflation and the Fed’s monetary policy. Anything that can help contribute to improvement in these two factors are what investors are looking for. So, a cooling of inflation should allow the Federal Reserve to pause its restrictive policy. It may pause its rate hikes to measure the cumulative effect of a 4.5% rise in short-term rates, but the Fed continues to take out $95B of liquidity each month and is therefore still restrictive. Nonetheless, bad economic announcements are seen as a positive to support the Fed stepping off the gas and good economic announcements support the argument for a soft landing. Any indication of inflation rising again to encourage the Fed to go higher for longer would solidify the argument for a hard landing. In addition, if employment data worsens and layoffs spread from the tech industry to others, it could also support the argument for a hard landing.
ISM Numbers
The ISM Manufacturing Index peaked in 2021 and has been contracting since November. The latest reading for January shows that this trend is continuing with a drop to 47.4 from 48.4. A leading component, new orders, continues to slip as well down to 42.5 from 45.1, as well as for production which also contracted again in January. The prices component rose off the December low despite the continued contraction in manufacturing, though at a reading of 44.5 it’s still registering a contraction reading. The employment index has shown little change remaining at a neutral reading of near 50.6. Manufacturing has been in steady decline throughout 2022 and shows no sign of reversing in 2023 yet.
The ISM Services Index dropped briefly below 50 in December, but the recent announcement last Friday showed a significant reversal, well above consensus estimates, from 49.6 back up to 55.2. New orders surged as well as business activity. A snap back in the services index in January is common as the holidays come to an end and new orders pick up. Eight industries increased employment while seven reduced employment in real estate, rental and leasing, arts, entertainment and recreation, and transportation and warehousing. Some of those industries said they’re unable to hire qualified labor and supply is thin while others said they were laying off and not replacing workers. While the prices paid component is 10 points higher than its average, the price index is at its lowest since January 2021. The end result showed that demand for services is still robust despite the lull in December.
Housing
Housing is an early-cycle industry that is important to watch. Typically, when housing turns up, so does the economy. Inventories have been climbing. While high-end housing turns lower because of the diminishing wealth effect of falling asset prices (stock market in 2022), the next phase is when labor markets contract and add to ongoing weakness.
Housing prices have begun to fall as mortgage rates have climbed considerably in the past year. The combination of high housing prices and high mortgage rates has limited the demand. For several months, the monthly rate of change has been negative with the year-over-year rate approaching 0%.
Case-Shiller US National Home Price Index

Home sales continue to decelerate with existing-home sales down 34% versus a year ago for the December numbers. The other issue is that because mortgage rates have doubled over the year, there is a disincentive for homeowners to sell their home which is the only thing keeping the supply of houses on the market from skyrocketing. However, if employment deteriorates, this may be a forced outcome in a hard landing.
New home sales ticked up in December by 2.3% but this is 26.6% lower than year-ago levels. Pending home sales were also higher in December by 2.5%, ending a 6-month deceleration.
The recent drop in mortgage rates (6.58% in December to 6.19% for a 30-year fixed) has been a welcome change. Rates dropped slightly in anticipation of the Fed pausing its plans to raise short-term rates. While the mortgage application data has improved, it is still a far cry from activity a year ago which is 37.8% lower as of the latest weekly data. The spring buying season may see applications tick higher but they will likely still remain below year-ago levels due to high prices and higher mortgage rates, relatively speaking.
Employment
January’s employment report will either be an anomaly or the stamp of approval on the soft landing argument. Nonfarm payrolls rose an astounding 517k to beat estimates while the November and December figures were revised higher a combined 71k. The average gain over the past few months was below 250k before the January report and the recent reading boosts that above 350k average gains. The unemployment rate ticked down to 3.4%. The only industry decline came from information technology with the majority of growth seen in healthcare and leisure and hospitality. Average hourly earnings growth was in line with expectations at 0.3% and up 4.4% over the past year. This area hasn’t seen the huge inflation numbers we’ve seen in food and other areas and is encouraging for the Fed to allow a pause in its hikes. Powell has repeatedly targeted his worries over persistent wage inflation – which so far is nonapparent. While this one monthly data report is a significant reversal from previously lower monthly gains, the three-month average of 350k is still below the average monthly gains seen at the beginning of 2022 of 515,000. The one thing the employment data is not doing is complimenting the argument over a hard landing in the economy. There has been no significant signs that the labor market is weakening towards recession here in Q1 of 2023. And so, this will be the most important economic indicator to follow later this year as economic uncertainty persists and higher interest rates are here to stay.
BLS Unemployment Rate

Earnings
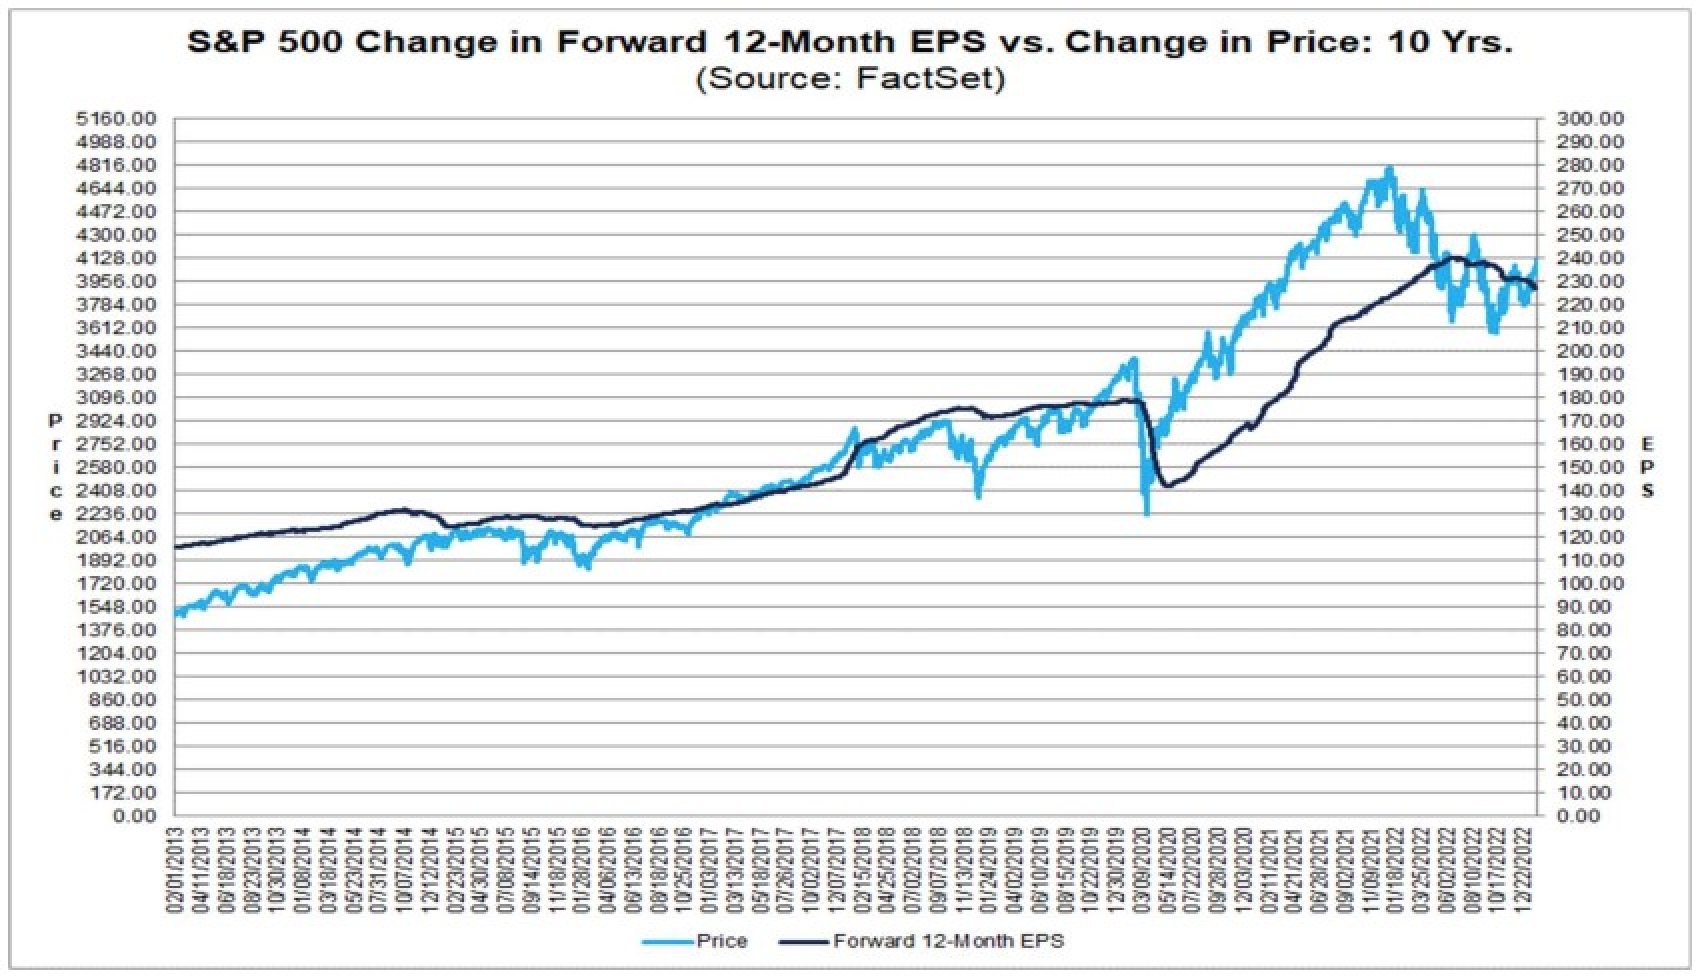
50% of companies in the S&P 500 have reported earnings this season with only 70% reporting positive earnings surprises and 61% reporting positive revenue surprises. Both readings are below their respective 5-year averages according to FactSet. Actual earnings are set to decline negative 5.3% according to FactSet for the fourth quarter with the blended report for those that have announced earnings combined with estimates for the other 50% left to report. This will be the largest decline since Q3 of 2020. Analysts are also lowering estimates for the coming first quarter of 2023 well below what analysts have normally discounted over the average five years. Analysts have decreased earnings per shares estimates another 3.3% during the month of January which FactSet says is a larger discount compared to the 5, 10, 15, and 20-year averages. Finally, because earnings estimates have fallen and prices have risen, the multiple on the S&P 500’s earnings has increased to 18.4 from 16.7 since the end of 2023. While this is typical during the early stages of a new bull market, it will make the valuations more vulnerable if the probability shifts from a soft landing to a hard landing later in the year. The chart below shows a correlation between the drop in the price of the S&P 500 and earnings estimates.
S&P 500 Price and Forward 12-Month EPS
Summary
The economic environment remains uncertain. ISM surveys show a consistent deceleration for manufacturing while the latest services data points to a very brief one-month contraction. Housing prices continue to fall month over month and the year ago change is approaching zero percent based on the trend. With interest rates persistently high, I’m not expecting a surge in buying activity and as long as employment remains strong, I don’t think we’ll see a large supply of houses come on the market as homeowners are loath to switch to higher mortgage rates. While the employment data was starting to weaken in the 4th quarter of 2022, it has recently picked up strongly in the month of January and time will tell if it was a one-month wonder or the beginning of a recovery. The Fed’s Beige report which is an economic summary of the 12 regions observed by the Fed said that companies are hesitant to layoff besides those we’ve seen in the tech industry. The employment data for January continues to echo those concerns. Within services, 8 industries continue to hire while 7 have seen layoffs. Earnings continue to decline and analysts are downgrading their estimates for the future quarter. The recent rally has not been supported by growth in earnings but through multiple expansion or speculation. Bad economic results are seen as supporting the Fed pausing its rate hike trajectory, while good economic results support the condition of a soft landing. The margin of error for the bulls is high with the current uncertainty in economic conditions and the decline in earnings. But as it stands today, without a significant rise in the unemployment rate, a soft landing is what investors will get.
Strategy
In the past economic and market cycles, it was clear what got us in the bubbles or busts in the past including the Covid Pandemic as a man-made recession through the shuttering of businesses. All it took was stimulus from the Federal Reserve and the government and pent-up demand to allow for a market and economic recovery. While supply-side shocks have been reduced, the Federal Reserve has been playing catch-up and on the surface appears to be achieving its goals of disinflation. The current trajectory assumes a 2% inflation target can be reached in 10 months if there are no significant resurgences of energy, food, housing, or wage inflation. It is incredibly difficult now to justify a bearish outlook in the face of technical and fundamental data that doesn’t point to a hard landing. A neutral stance on risk in stocks, bonds, and commodities makes sense currently. As such, investors should have an allocation in those areas matching their benchmarks for various risk and growth objectives.
To learn more about Financial Sense® Wealth Management, click here to contact us.
Advisory services offered through Financial Sense® Advisors, Inc., a registered investment adviser. Securities offered through Financial Sense® Securities, Inc., Member FINRA/SIPC. DBA Financial Sense® Wealth Management.
Copyright © 2023 Ryan Puplava


