


Originally posted at ExecSpec.net
Our September warning of an October correction lasting until election day November 6 warranted a defensive posture for investors. Looking at the 200-day moving average (dma) of stock indices partially illustrates our subdued current outlook.
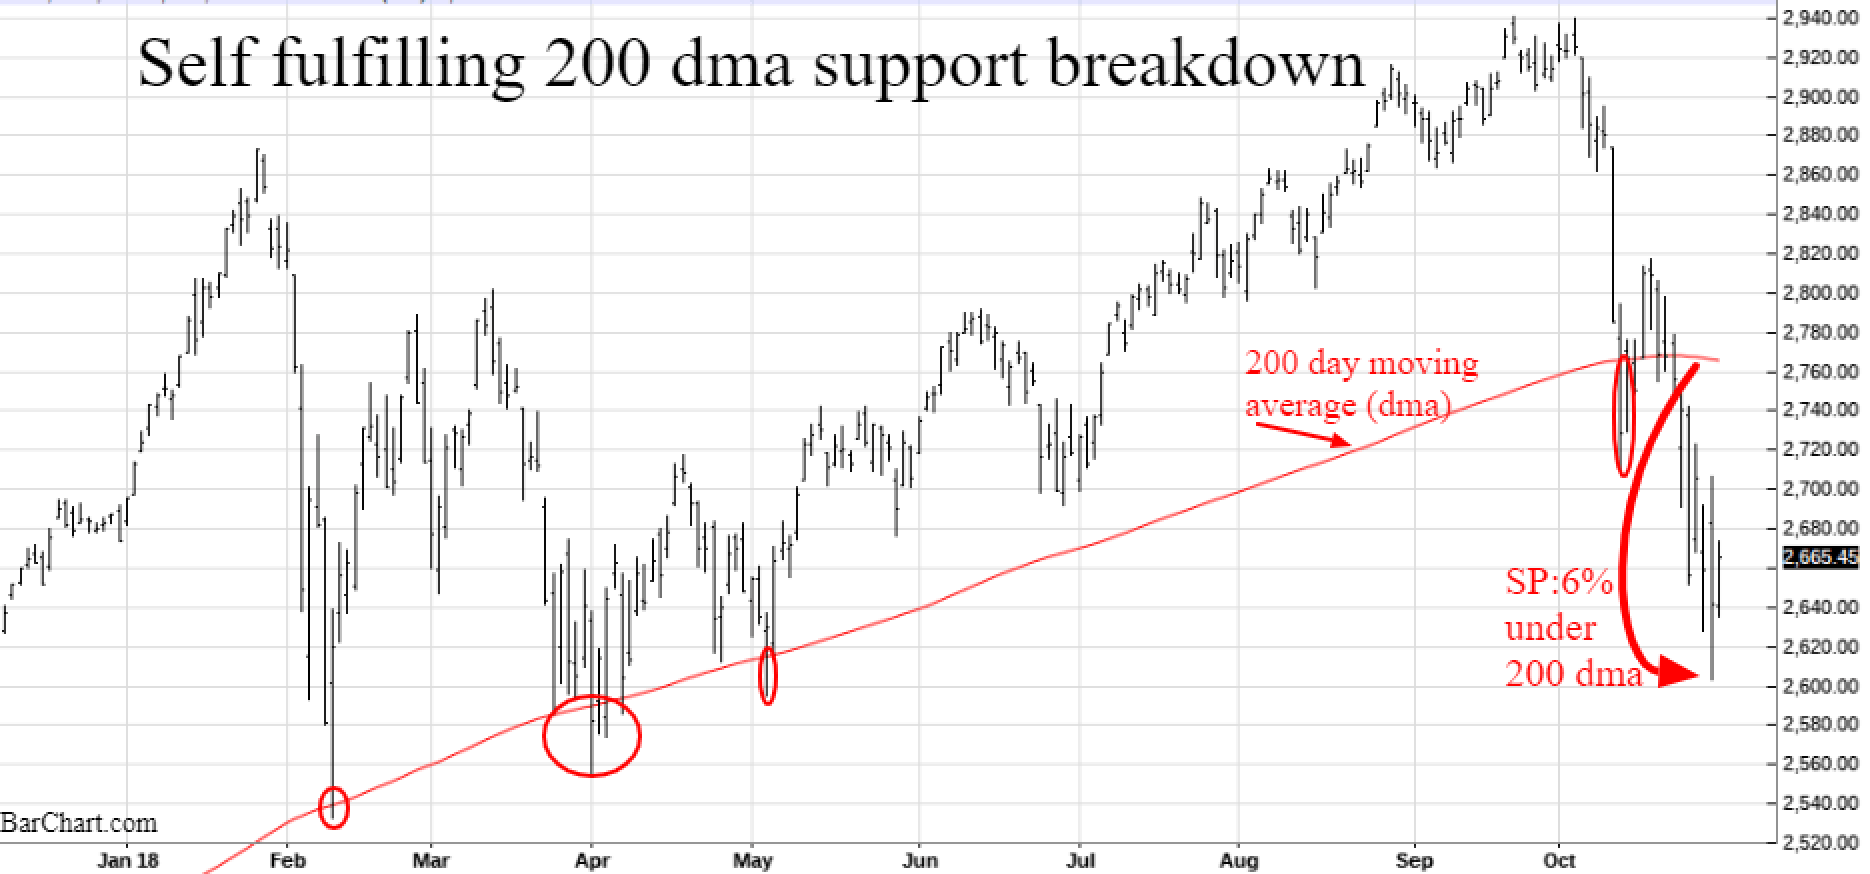
Half way through the stock market's October plunge, we witnessed the break of the vaunted 200 dma of price. Our observation of its 20+ year track record indicates over 70 percent of the time the breaks of this moving average are brief and painless for investors to remain fully invested or add new positions. On the other occasions when stocks break under the 200 dma, the price correction is often over 10 percent to as much as 50 percent and requires months before the market can declare the low has arrived and it's safe to invest.
The current market correction is down roughly 11 percent intraday form the Oct. 3 peak and six percent below the point when this moving average was broken, so statistical there is time and price potential for more pain in the months ahead.

A closer look at the 2018 daily S&P 500 Index shows how money managers and analysts have a disproportionate focus on the the 200 dma. We only look at it from a counter psychology aspect since so many others make this metric a self-fulfilling factor of their forecasts.
In the market plunges of February, April, May and even early October of 2018 it's clear that investors drew a line in the sand and started buying stocks as the 200 dma was tested. There isn’t anything magical about this convergence, only that when its talked about too much as a level of support, it sets up market psychology for a stop-loss fund selling wave as the breakdown becomes more evident.
On the latest decline below the 200 dma we finally have market psychology becoming overly pessimistic and conducive for bottoming action in early November. The late January – early February correction of 12 perecnt was larger than this October drop, so far. However, that early 2018 decline held the 200 dma and was far too quick to generate deeper oversold levels of pessimism. This correction is already generating more pessimism than at the 12 percent lows in February and we would expect even more negativity before this market is ready to continue the bull market.
A closer look at a larger break of the overly hyped 200 dma shows that even in a strong bull market we have periods like the 2015 – 2016 breakdown that lasted seven months before the market healed enough to resume its historic run to record highs. Back then it was the collapse of oil prices from over $100/barrel to under $30/barrel that created concerns of slowing global growth. This time, its all about tariff-induced China/global slowing combined with our Fed’s assertion that they will keep raising rates until recession worries become more evident.

The 200 dma works as support in a bull market until it doesn’t. Serious market breakdowns such as in 2008 or even 2015 occur due to some underlying fundamental factors lowering future growth expectations. While we don’t expert the severity of a 2008 mortgage bubble panic, the fundamentals needed for higher 2019 growth rely upon positive changes in the actions of our Federal Reserve and, more importantly, in China.
The Fed has intimated that it doesn’t care if inflation falls as it needs much weaker economic data ( lower stocks) before it will stop raising rates. A cynic would say they want to keep raising rates until they cause a recession, so they have room to then lower rates.
Regarding China, we have stated in interviews and in our reports over the summer that Trump didn’t really want a realistic trade deal with China and thus there would be no deal until more pain was felt, as Trump intended. The pain has only barely begun, but it’s already causing stellar 3rd quarter earning reports to be ignored due to the lower guidance fears of a slowing China.
Our crystal ball is less clear about this market resembling the lengthy 2015-2016 corrective period in stocks, but the potential is there should the Fed and China maintain their rigid stances. A China trade deal and a Fed showing more flexibility on rate hikes would allow for a sharper than currently forecasted economic rebound in 2019 from the current 4th quarter lull. No progress on either front will likely keep stocks in a trading range above and below current levels. Shorter term, we expect our forecasted October to early November correction low to morph into a trading range affair until China and the U.S. talk trade in December .


